Welcome to the pmean blog. Please note that pmean is short for Professor Mean, my alter-ego on the Internet. My real name is Steve Simon.
This site has over 2,200 files covering statistical analysis, research ethics, and evidence-based medicine. It’s a bit of a rat’s nest, to be honest, with simple tutorial pages for total beginners to very technical pages for advanced audiences. It is also in transition from an earlier version of my website.
You can find earlier entries at
Some of the pages on these sites are completely broken, partially broken, have missing images, etc. My goal is to use the new site to fix up every bad page and crosslink those files to the old ones. With over 2,200 pages, this will take a while. Refer to the [about page] to get a bit more information about the older sites.
I also have an early draft of a book, Jump Start Statistics
Aspects of the Social Organization and Trajectory of the R Project
New web recommendation
The Dataverse Project
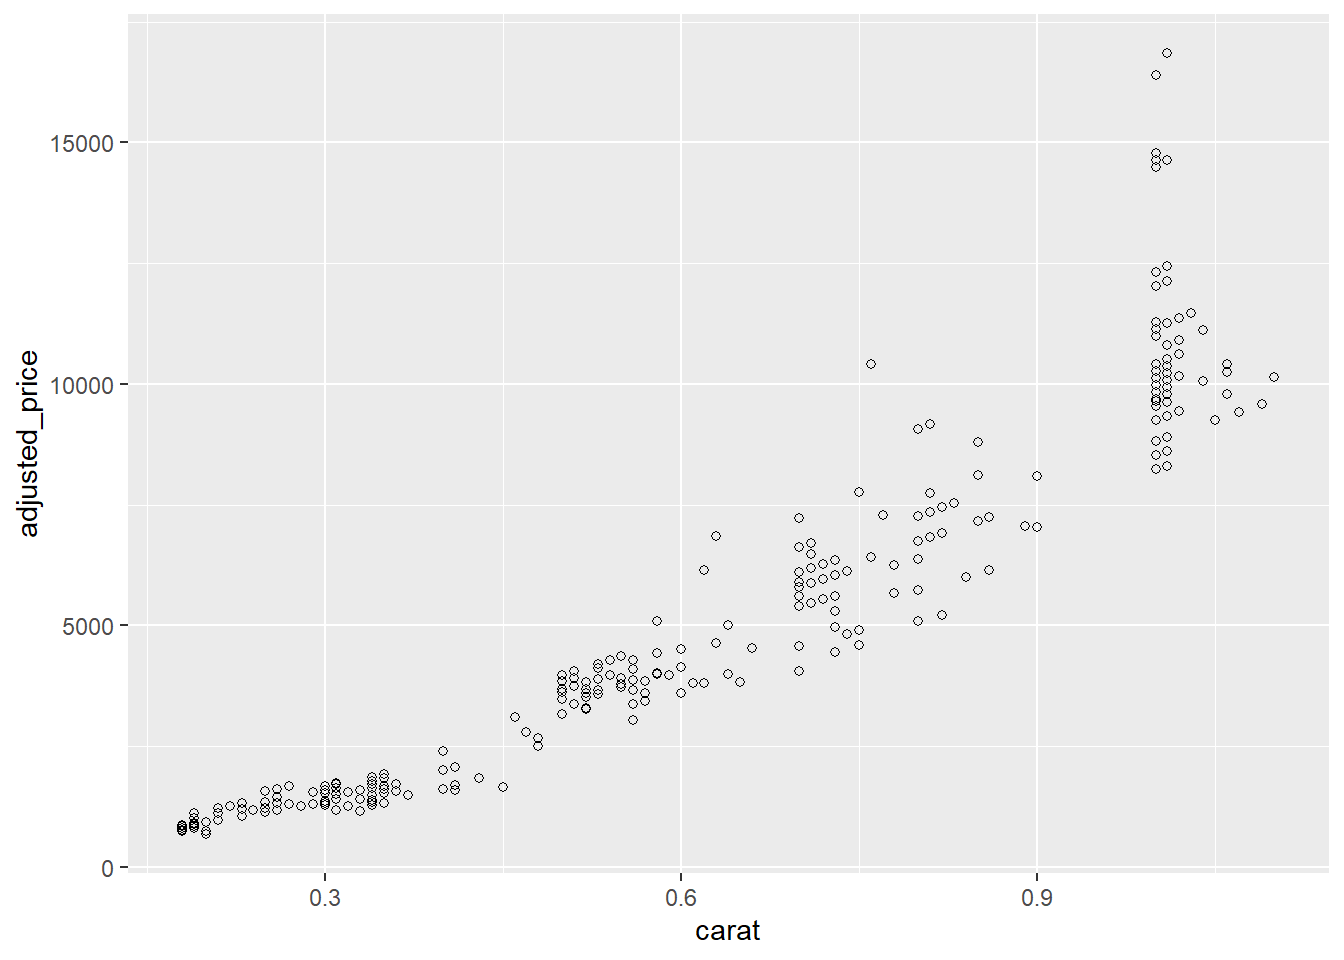
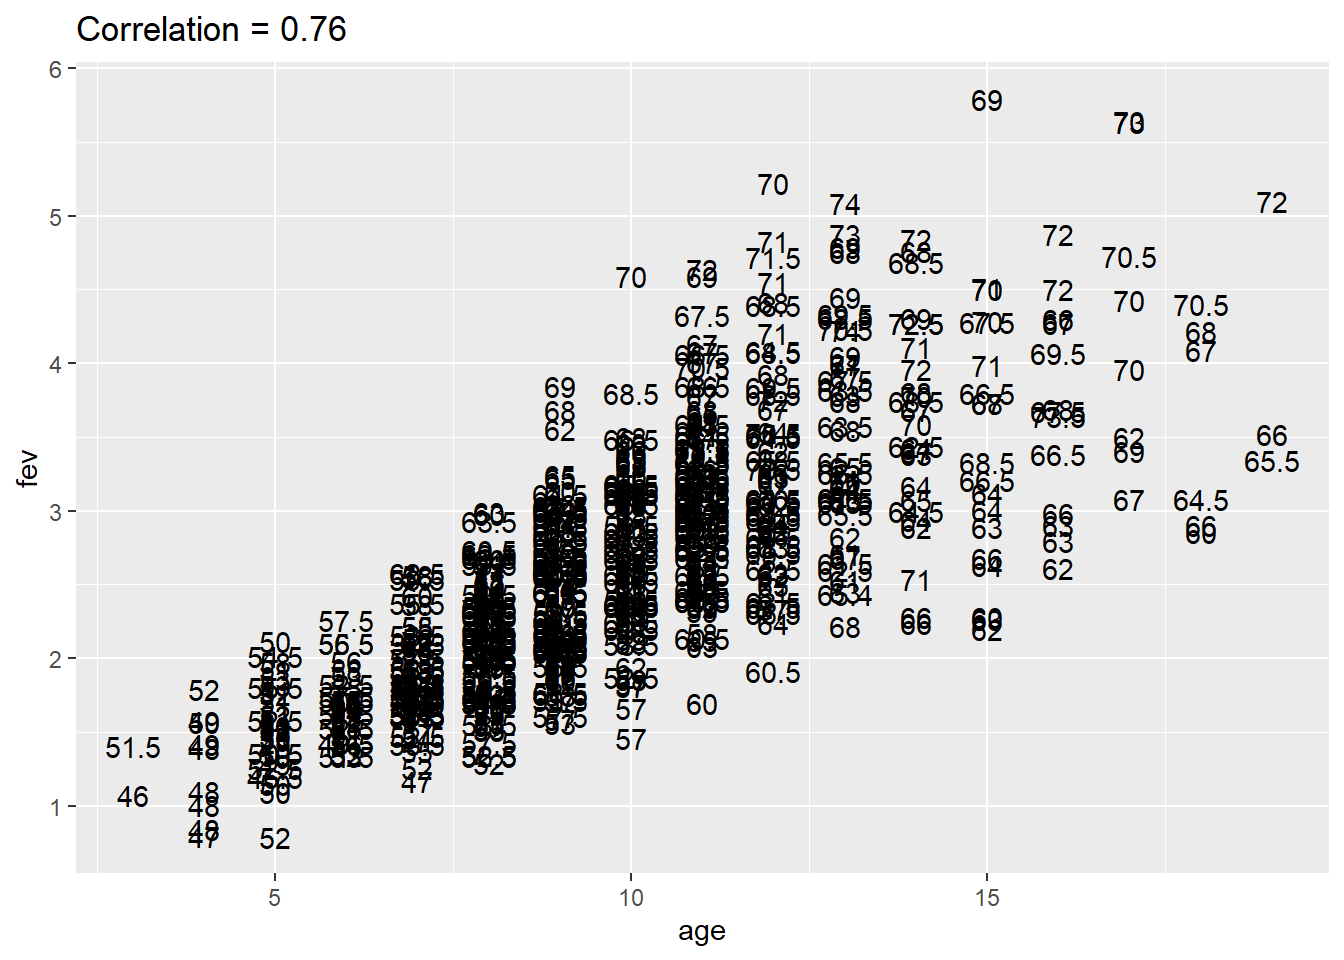
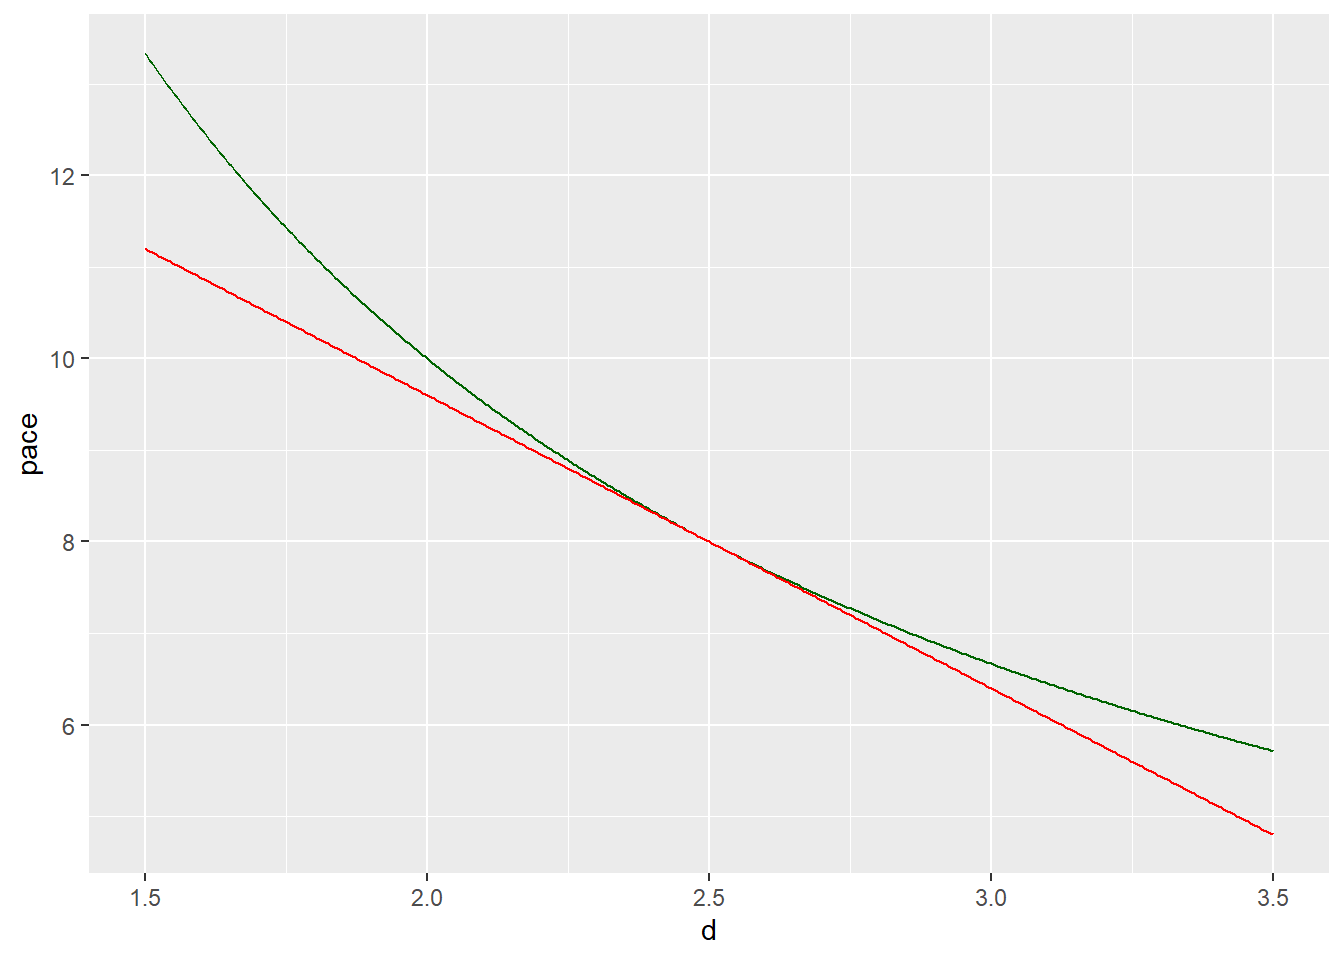
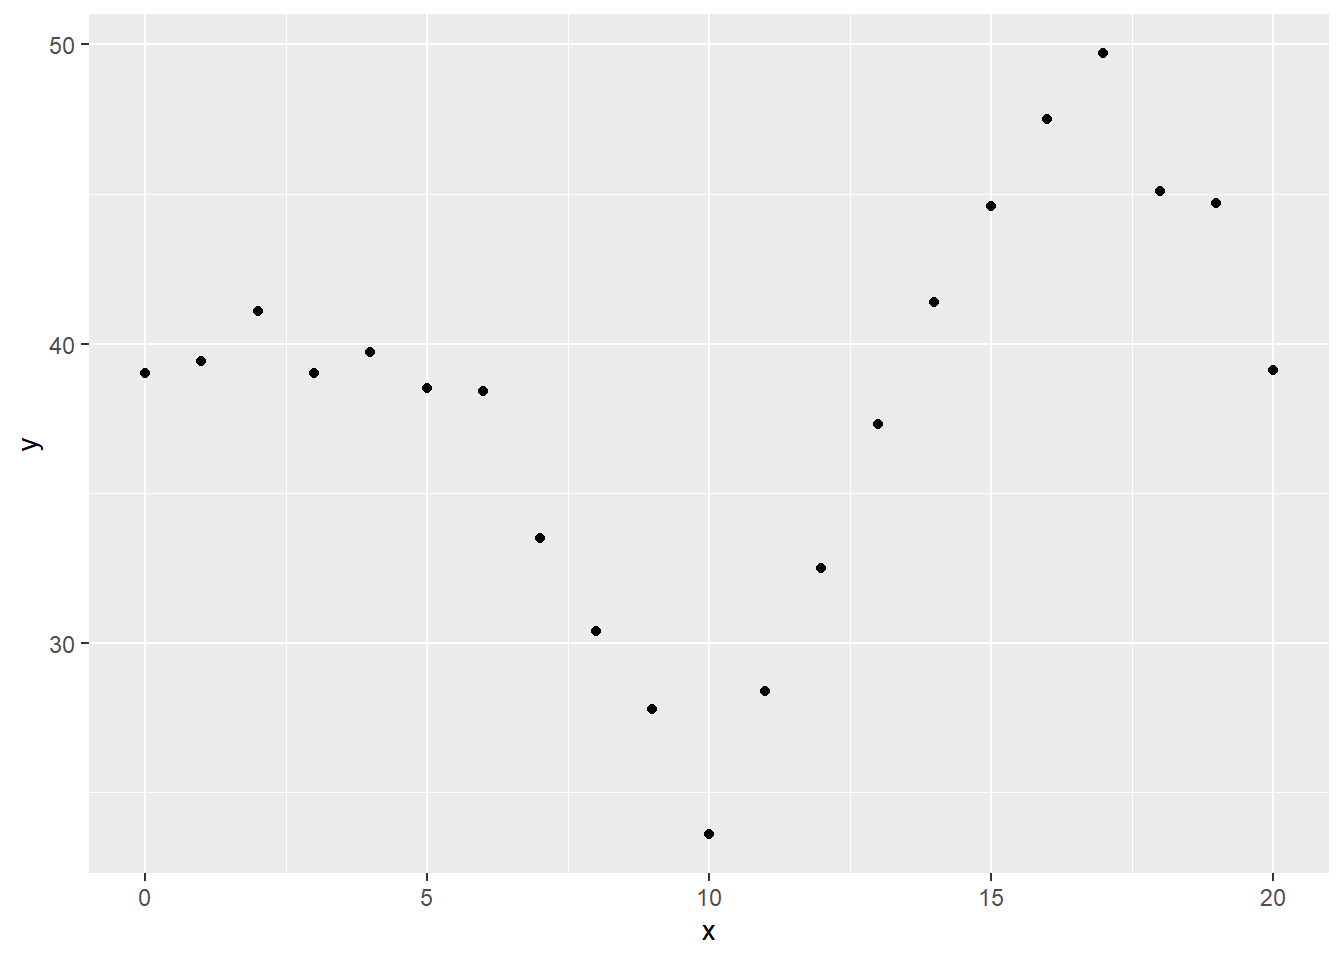
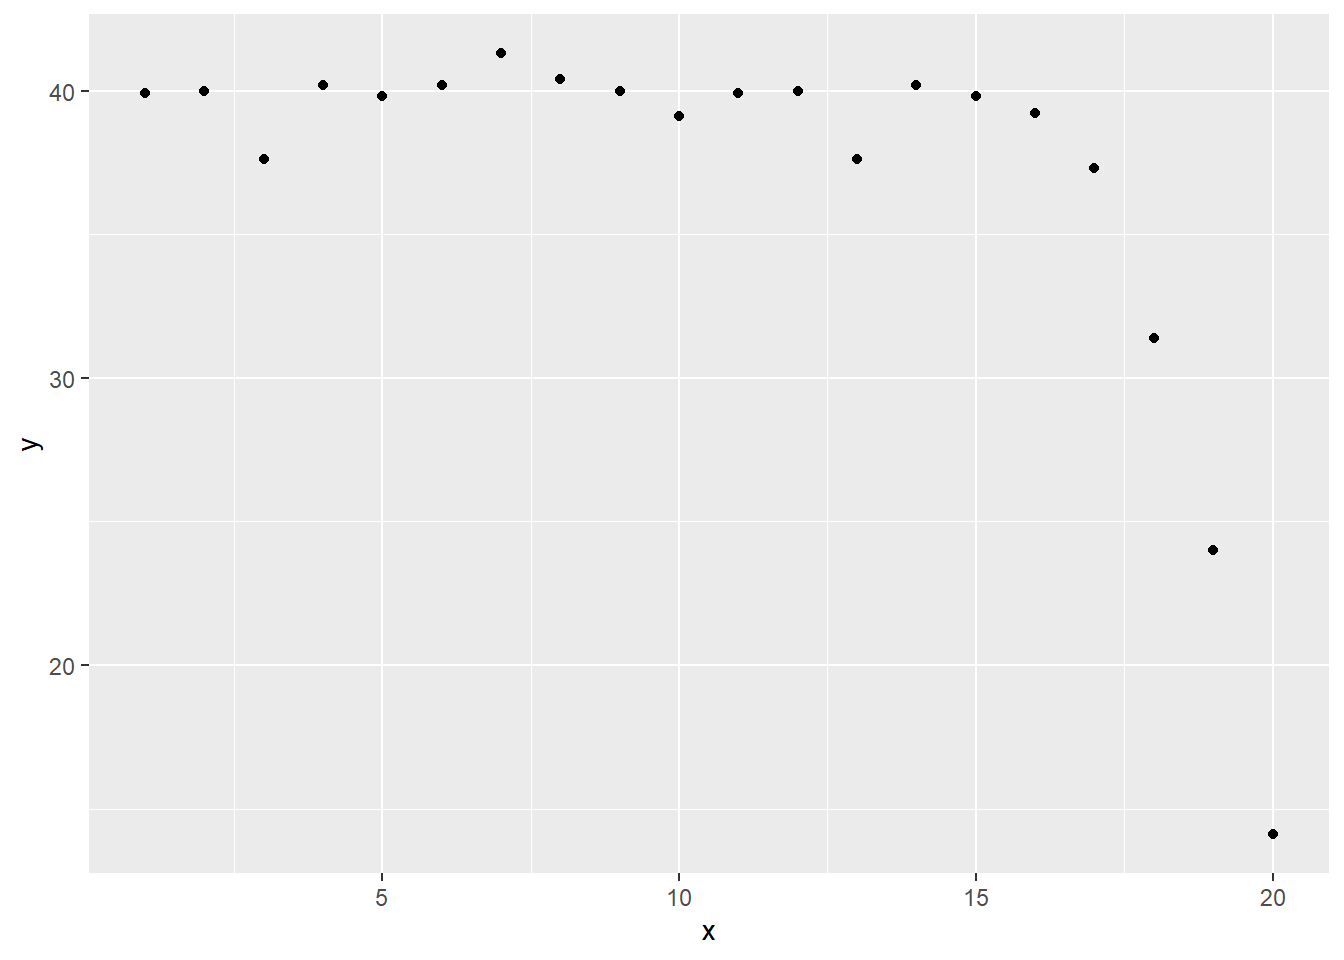
When do you need to address non-linearity?
When should you use a weighted mean?
Raynald’s SPSS Tools
Definition, Descriptive statistics
Definition, Normal distribution
Definition, Adverse event
Qualitative Research. The “What,” “Why,” “Who,” and “How”!
Choices with the group_by and summarize functions
Engaging People Most Affected by the Problem
Survival analysis sample size calculation
Enthusiasm at the start…
Resources for presenting research
String Encoding and R
A gentle introduction to SHAP values in R
AI and the Meaning of Life
Nice layout for comparison of categorical outcomes
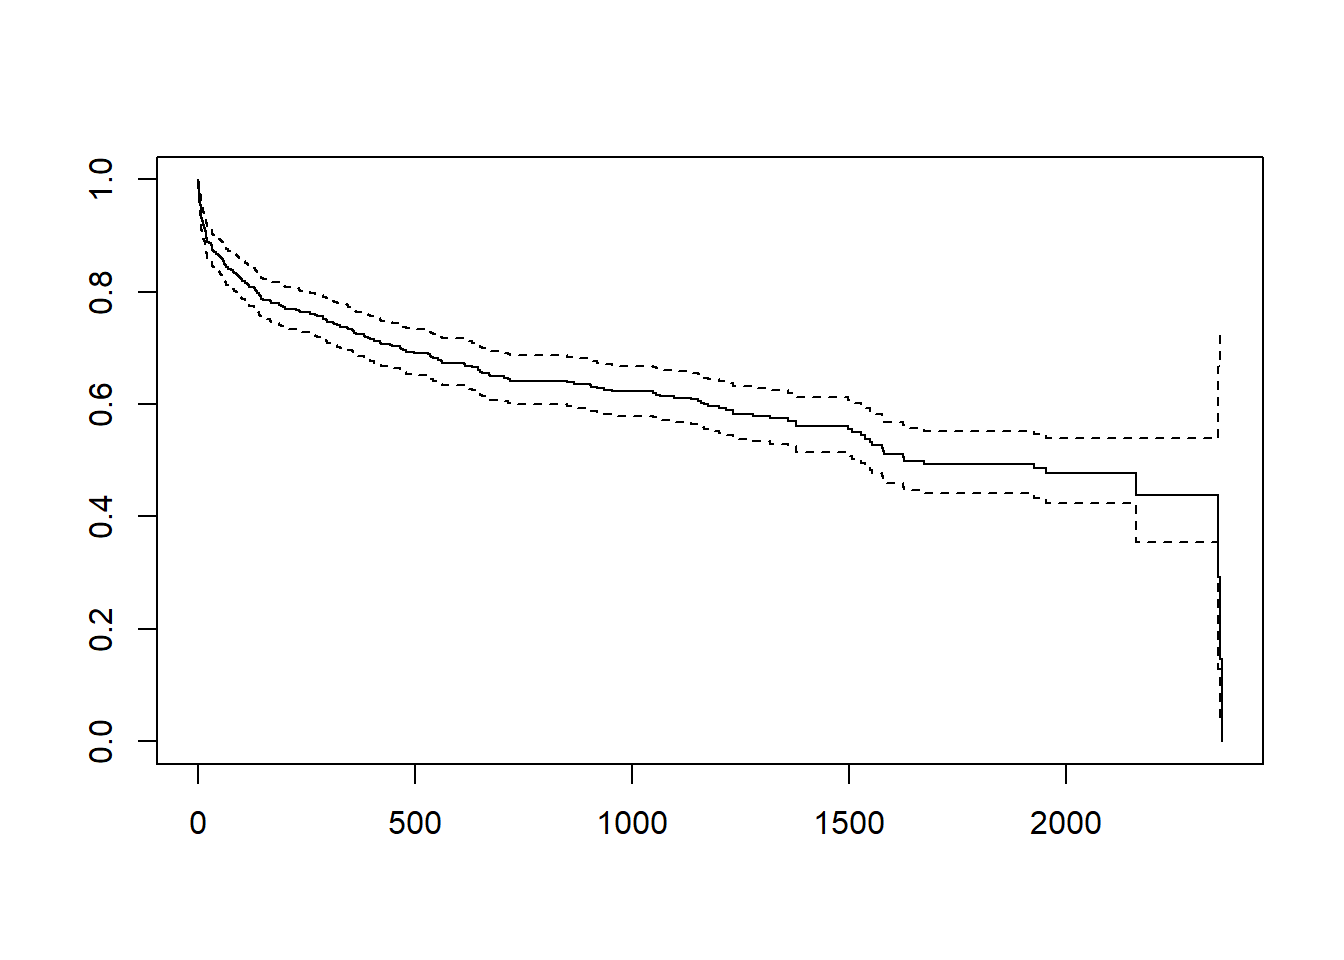
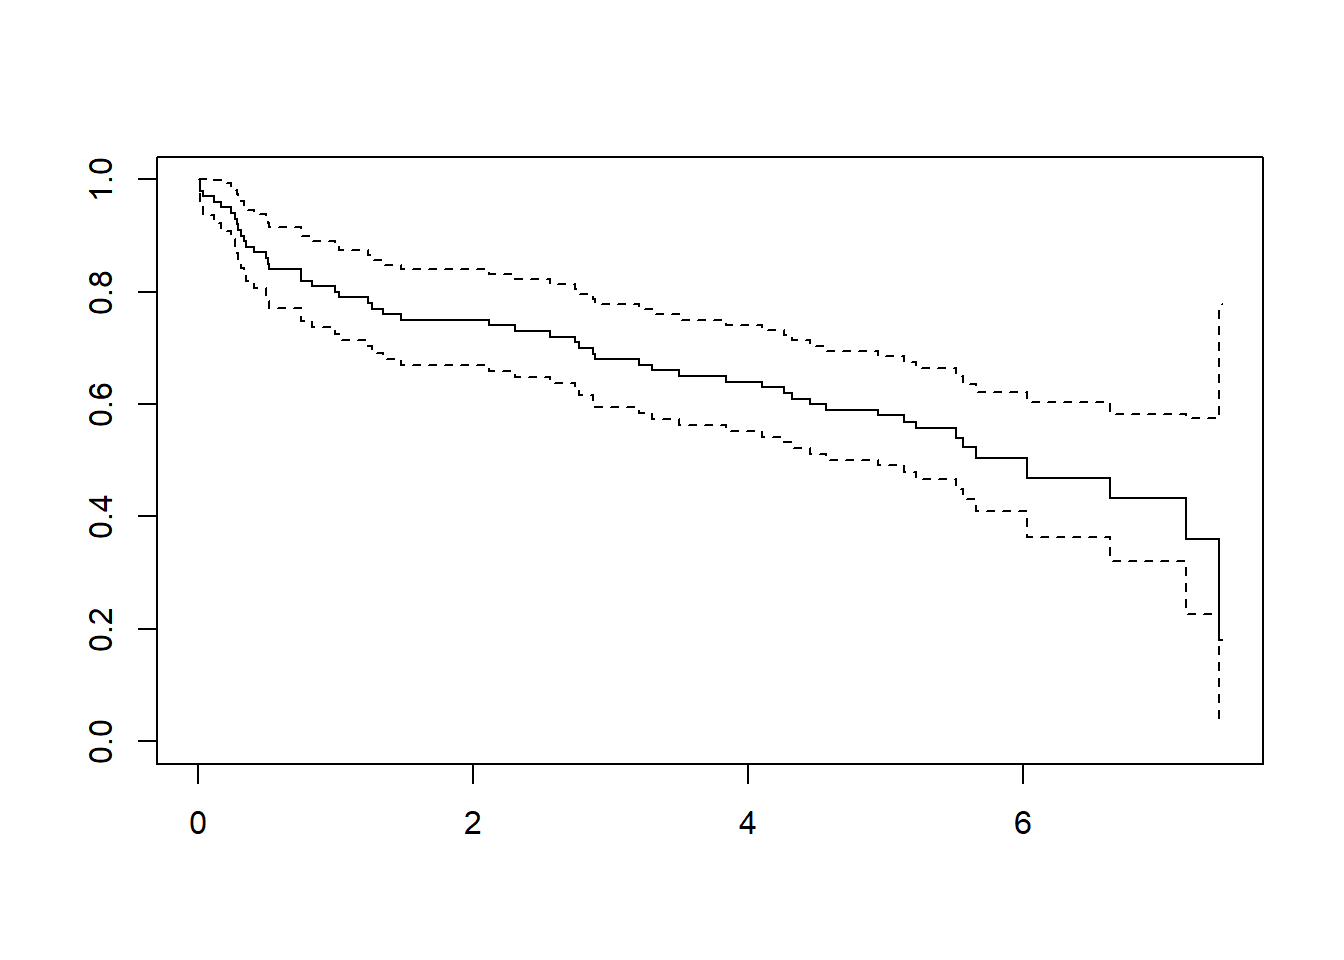
Different end times in survival data
R datasets
Illustrating the lasso model using the Worcester Heart Attack Study
Illustrating splines using the Worcester Heart Attack Study
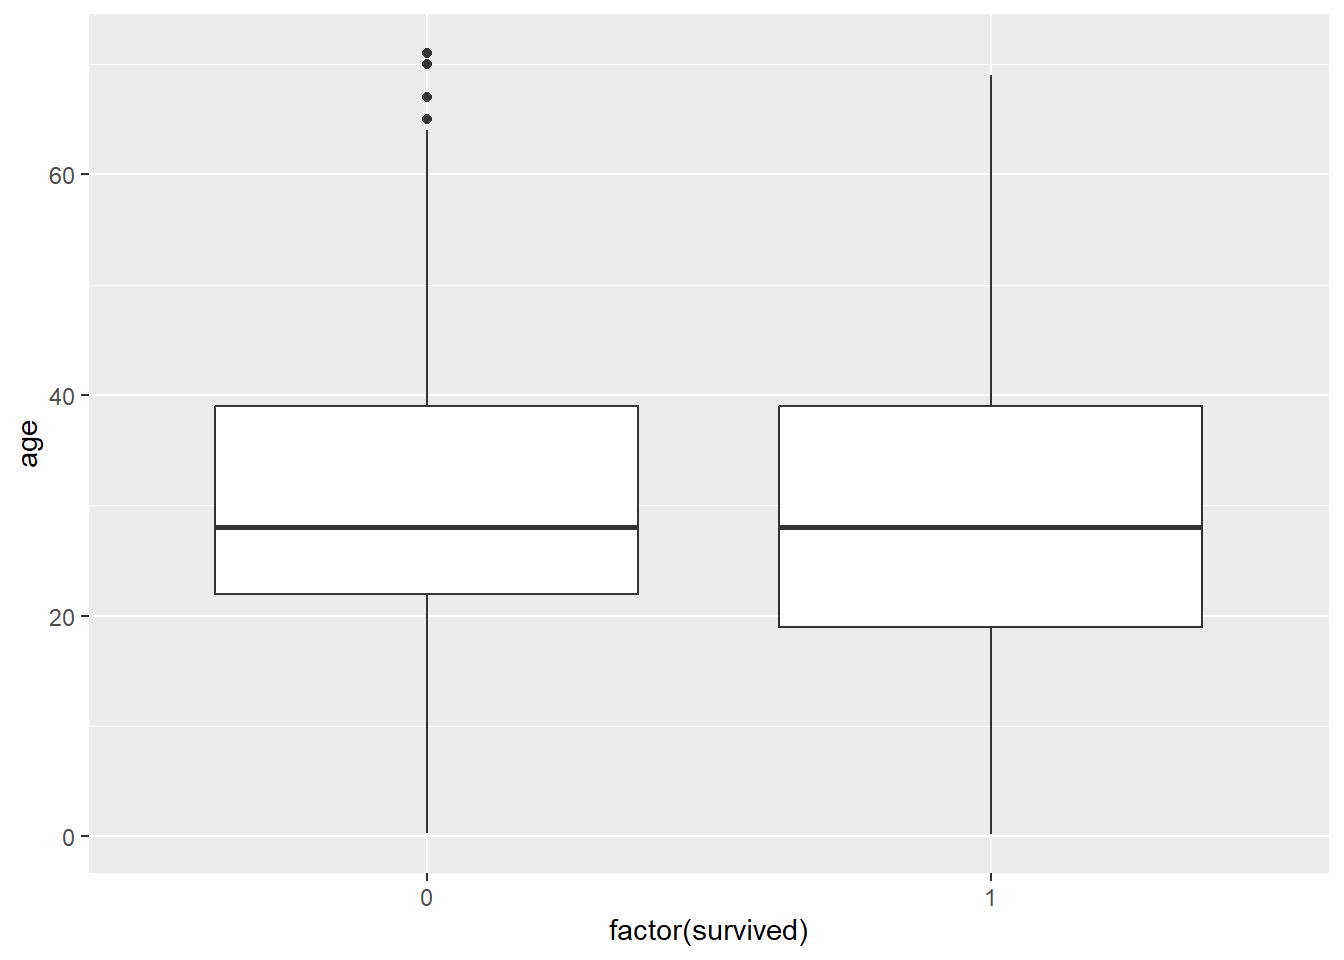
Illustrating splines using the Titanic dataset
R Inferno
Finding customers webinar
“Final”.doc
A review of spline function procedures
The Art of LaTeX
The parsimony principle…
With four parameters…
Joining Posit’s Polyglot Data Science Mission
McNemar’s test
UM system resources for generative AI
Introduction to Data Technologies
A few details about myself
Modern Data Science with R
Primer on Python for R Users
Florence Nightingale’s legacy lives on
Version control basics, updating a local project using git
How can I estimate relative risk using GLM for common outcomes in cohort studies
Resources mentioned during SDSS
Re-Reading Deming’s 14 Points in the Era of Data Science
An Introduction to the Harrell”verse”

The modified power prior
The hedging hyperprior for the exponential distribution
Confirmation bias as a misfire of normal Bayesian reasoning
D3, Data-Driven Documents
Schoenfeld residuals
The POSIX time standard
Confusion caused by multiple date formats
Internal storage format for dates
Missing value functions
Missing value hell
Recommendation for the oral presentation at a thesis defense
Recommendations for qualitative research in five categories
Different parameterizations for one factor ANOVA
Dunnett’s test
Git cartoon from xkcd
SAS Tutorial | How to use Git with SAS
Understanding Random Forest
Library Research Tutorials
Testing d3
Definition, Adverse reaction
Definition, Alpha
Definition, Beta
Definition, Binomial distribution
Definition, Binomial mean
Definition, Binomial probability
Definition, Boxplot
Definition, Case-control study
Definition, Categorical data
Definition, Cohort study
Definition, Common cause variation
Definition, Conditional probability
Definition, Continuous data
Definition, Control chart
Definition, Convenience sample
Definition, Correlation coefficient
Definition, Cross sectional study
Definition, Crossover study
Definition, Decision rule
Definition, Dependent variable
Definition, Descriptive study
Definition, Diagnostic test
Definition, Entropy
Definition, Experimental design
Definition, Fagan nomogram
Definition, Geometric mean
Definition, Independence
Definition, Independent variable
Definition, Inferential statistics
Definition, Interquartile range
Definition, Interval data
Definition, Kappa
Definition, Likelihood ratio
Definition, Longitudinal study
Definition, Mann-Whitney-Wilcoxon test
Definition, Mean
Definition, Median
Definition, Mode
Definition, Mosaic plot
Definition, Negative predictive value
Definition, Nominal data
Definition, Observational study
Definition, Odds
Definition, Odds ratio
Definition, Ordinal data
Definition, Parallel groups study
Definition, Parameter
Definition, Percentiles
Definition, Phi coefficient
Definition, Binomial probability
Definition, Poisson distribution
Definition, Population
Definition, Positive predictive value
Definition, Purposive sample
Definition, P-value
Definition, Qualitative study
Definition, Quota sample
Definition, Random sample
Definition, Range
Definition, Ratio data
Definition, Retrospective study
Definition, Sample
Definition, Sensitivity
Definition, Special cause variation
Definition, Specificity
Definition, Standard deviation
Definition, Standard error
Definition, Statistic
Definition, Stem and leaf diagram
Definition, t-statistic
Definition, Type I error
Definition, Type II error
Definition, Weighted mean
Whose data set is it anyway?
An international multi-centre cohort study of weight loss in overweight cats
What Influences Saturation? Estimating Sample Sizes in Focus Group Research
What Influences Saturation? Estimating Sample Sizes in Focus Group Research
Scientific writing, Strategies and tools for students and advisors
The ASCCR Frame for Learning Essential Collaboration Skills
Using change scores
COSMIN methodology for evaluating the content validity of patient-reported outcome measures: a Delphi study
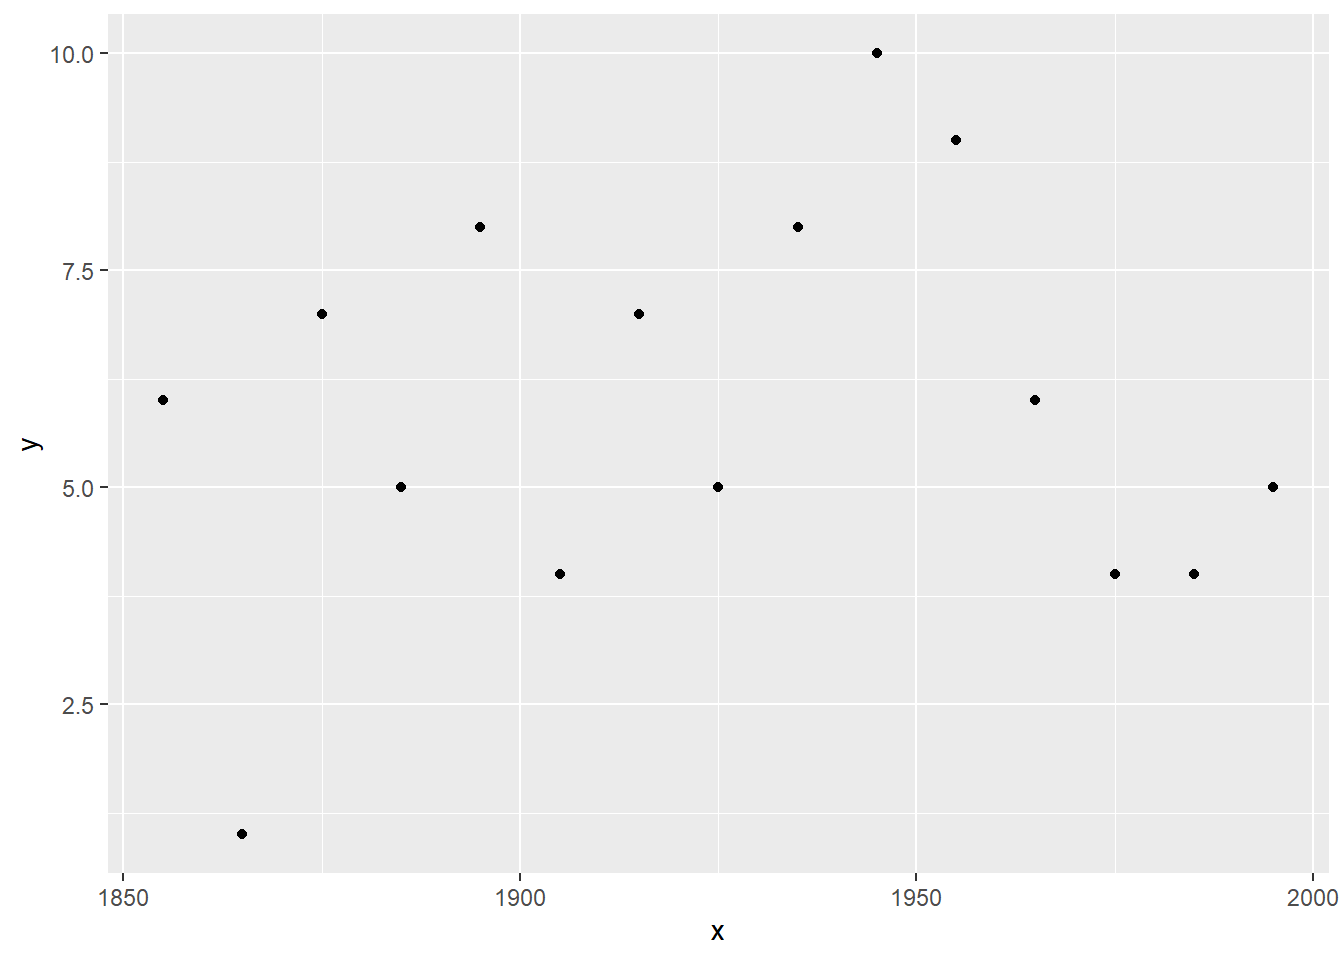
Overfitting example using hurricane frequencies
Big Deal for Open Access
Simply Statistics blog
Talk Stats
History of Teacup Giraffes
We Are in Need of Data Ethics Now
Basics of cubic spline models
Test diagrams
The Integration of the Humanities and Arts with Sciences, Engineering, and Medicine in Higher Education
VALUE Rubrics
Very simple spline models
The dark side of big data
What’s all this reading about then
How to Share Your Research
10 ingredients for a successful supervisor/PhD student relationship

Survival of the best fit
Ethical data science
Lead assessments in the NHANES survey
Diagnostics for a generalized linear model
Journals Must Stop Exploiting Research for Profits
First steps with blogdown
Health equity tourists: How white scholars are colonizing research on health disparities
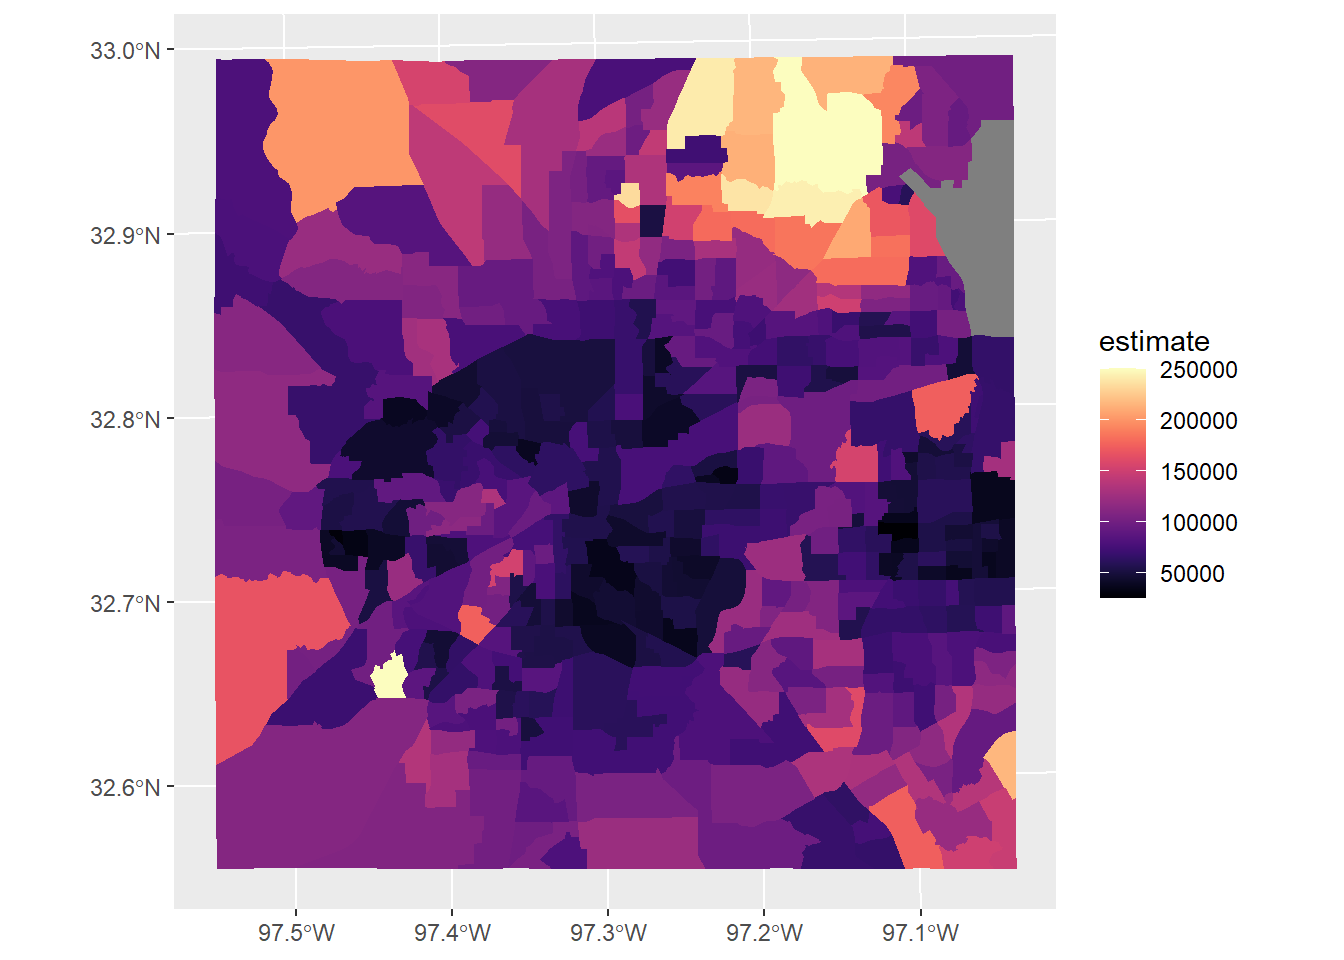
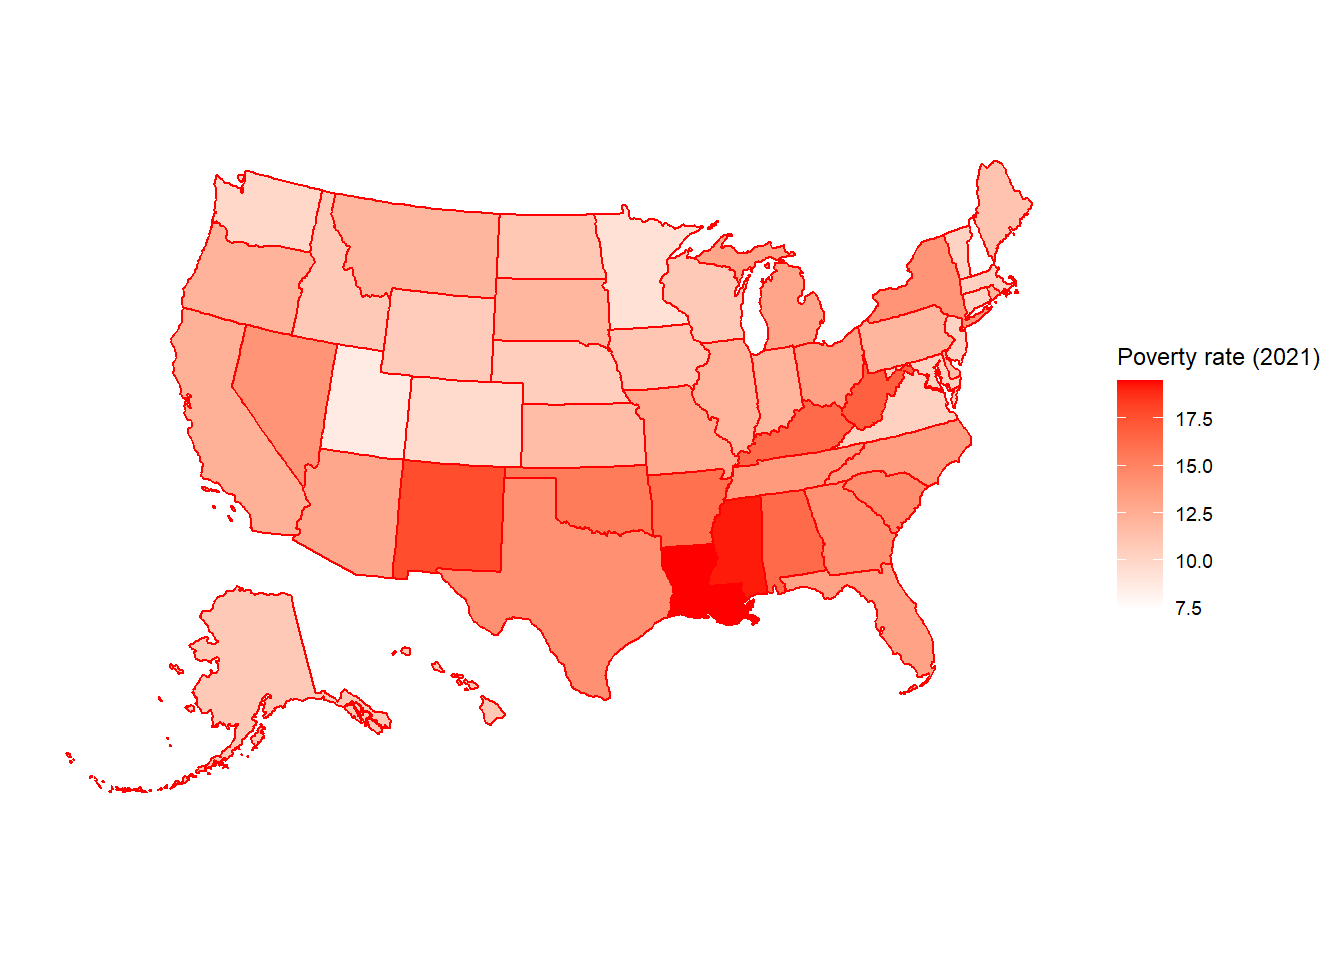
Reading information from the American Community Survey into R
Happy Git and GitHub for the useR
Direct standardization of mortality rates
Deviance in a generalized linear model
Quasi-likelihood models
Zero-inflated models
Working with negative binomial regression
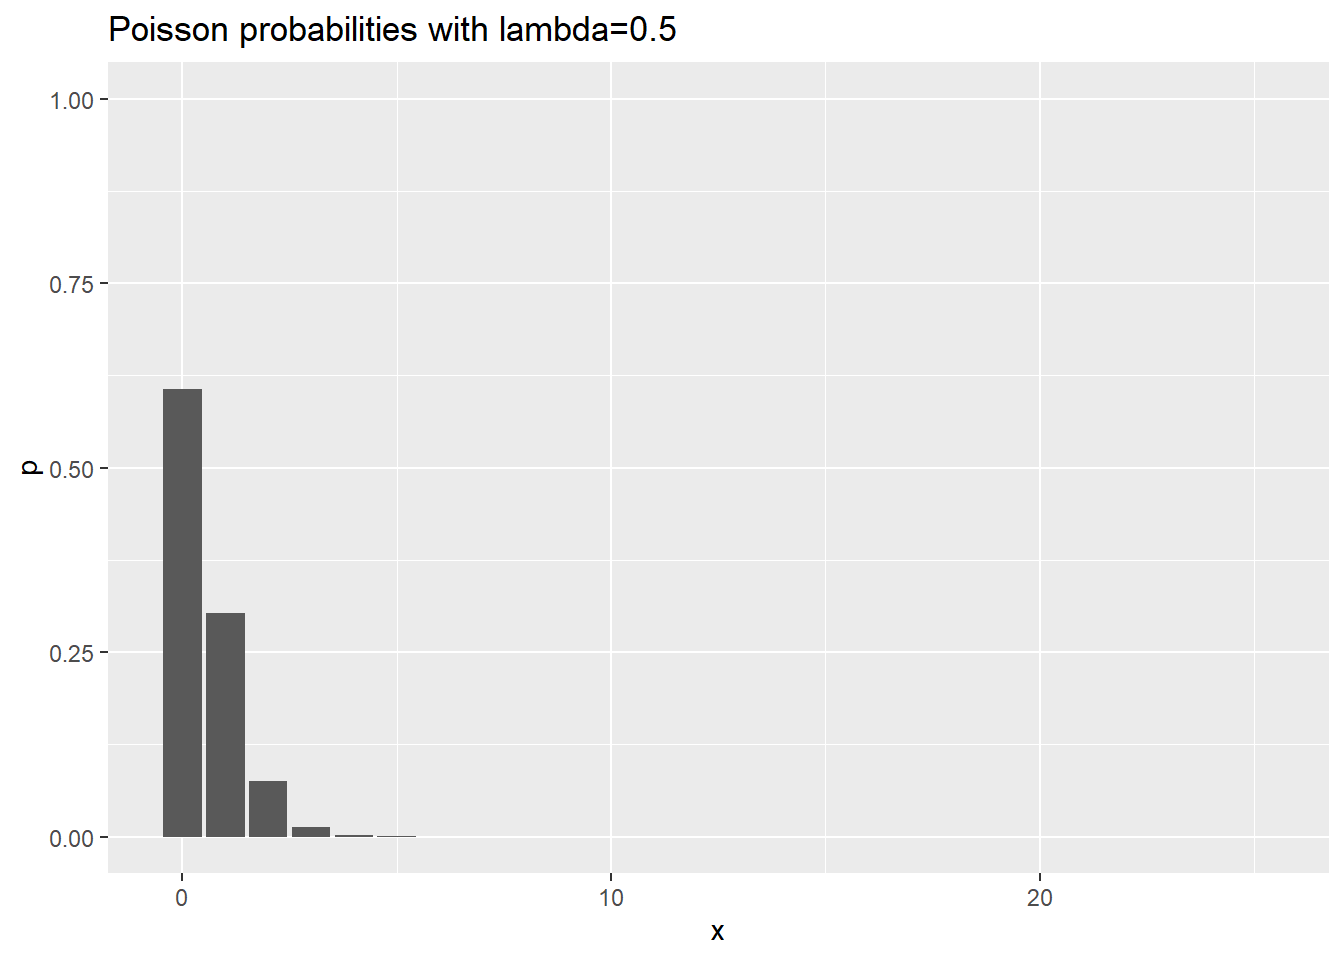
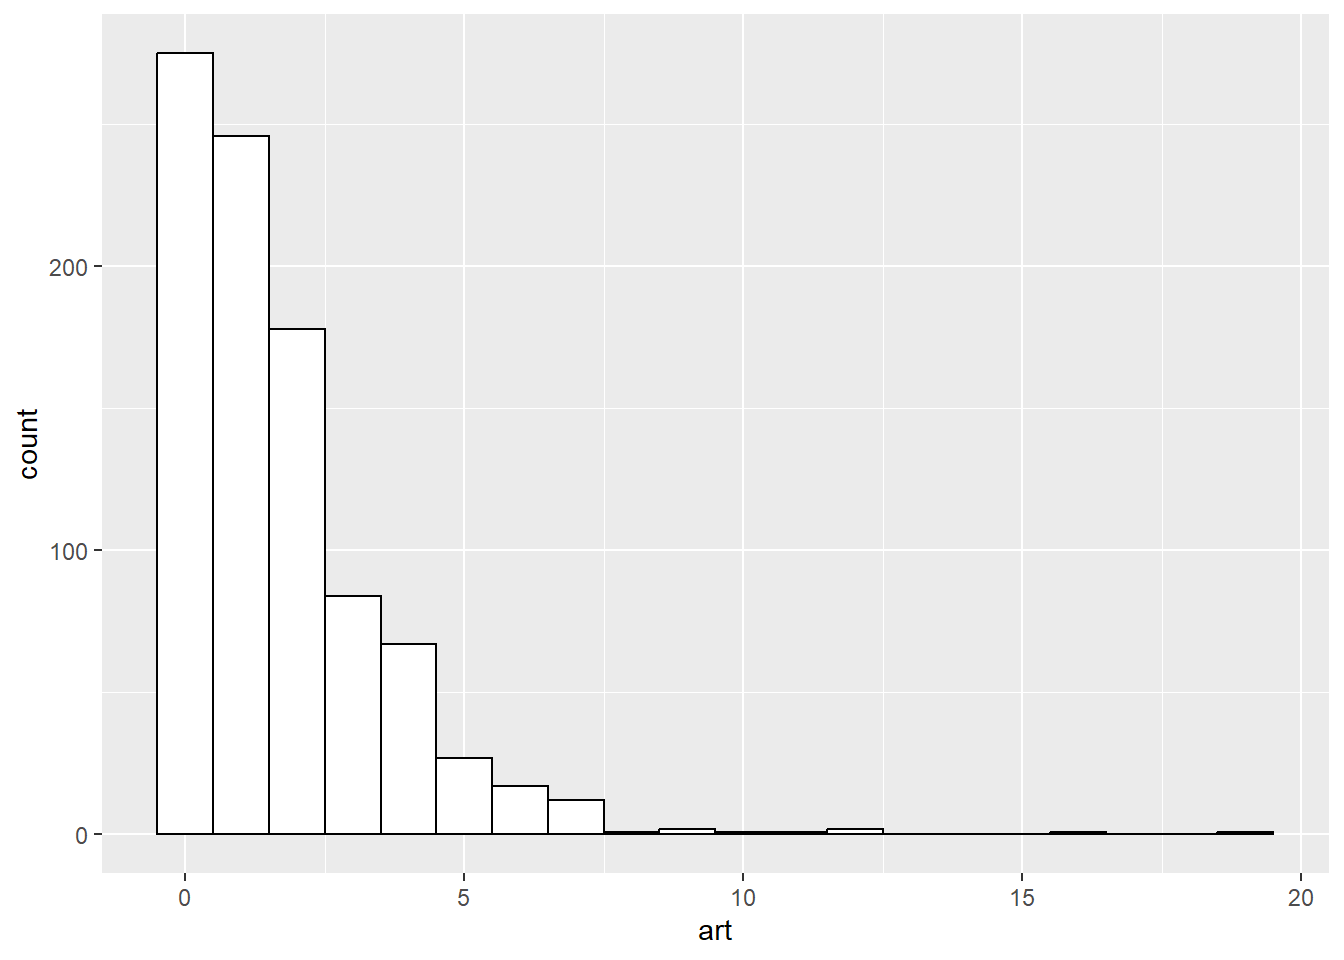
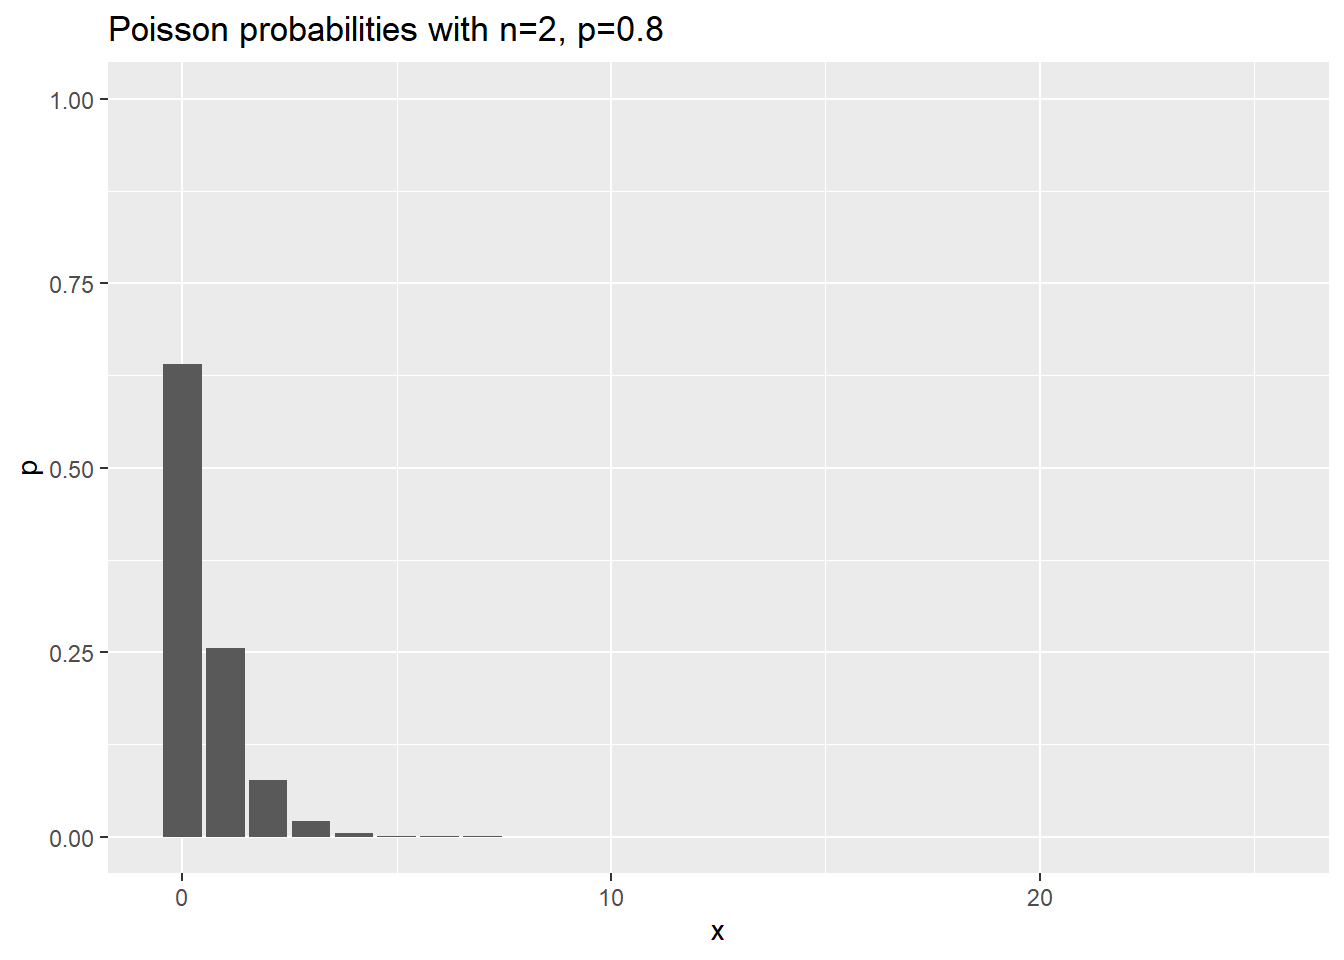
Working with the Poisson distribution
Working with Poisson regression
Show me the data
Real-world String Comparison
Asking great questions
Efforts of biostatisticians in research
The Vancouver Recommendations
Speaking R
How to Choose the Journal That’s Right for Your Study
Introduction to Formulaic
Metadata vignette
R Package for Adaptive Clinical Trials
Types of Statistics Papers
R Packages
Anonymizing ids
Songs by Tom Lehrer (1953), Lobachevsky
The illusion of predictability. How regression statistics mislead experts
COMPAS Recidivism Risk Score Data and Analysis
Heterogeneity introduced by EHR system implementation in a de-identified data resource from 100 non-affiliated organizations
Ethical AI: A Framework for Justice
Final.doc
Today’s False Prophets
RCT-DUPLICATE
Precisely the opposite of what we now know to be true
COVID-19 open source data sets
The tidy tools manifesto
How I use R Markdown to write research papers
Generalized Linear Models
Election Maps Are Everywhere. Don’t Let Them Fool You.
Disappearing Data
Making genome data come alive with circos plots
Stats + Stories
Warning: Physics Envy May be Hazardous to Your Wealth
Statisticians React to the News
AI Fairness 360 Open Source Toolkit
Relationship Between Total and Bioaccessible Lead on Children’s Blood Lead Levels in Urban Residential Philadelphia Soils
Setting the Stage: Statistical Collaboration Training Videos
Filed under: The differences
Data 8: The Foundations of Data Science
Simple Demographics Often Identify People Uniquely
Health statistics represent
How to be more effective in your professional life
Getting science published
The Scientist’s Guide to Poster Design
AMS Style Guide
Aleatory and epistemic uncertainties can completely derail medical research results
The Human Experience Will Not Be Quantified
Florida fired its coronavirus data scientist. Now she’s publishing the statistics on her own.
Tests of trend between disease outcomes and ordinal covariates discretized from underlying continuous variables
Constructing sound science and good epidemiology: tobacco, lawyers, and public relations firms
Steve Milloy misfires
Reading text files
Criticisms of the IHME COVID-19 model

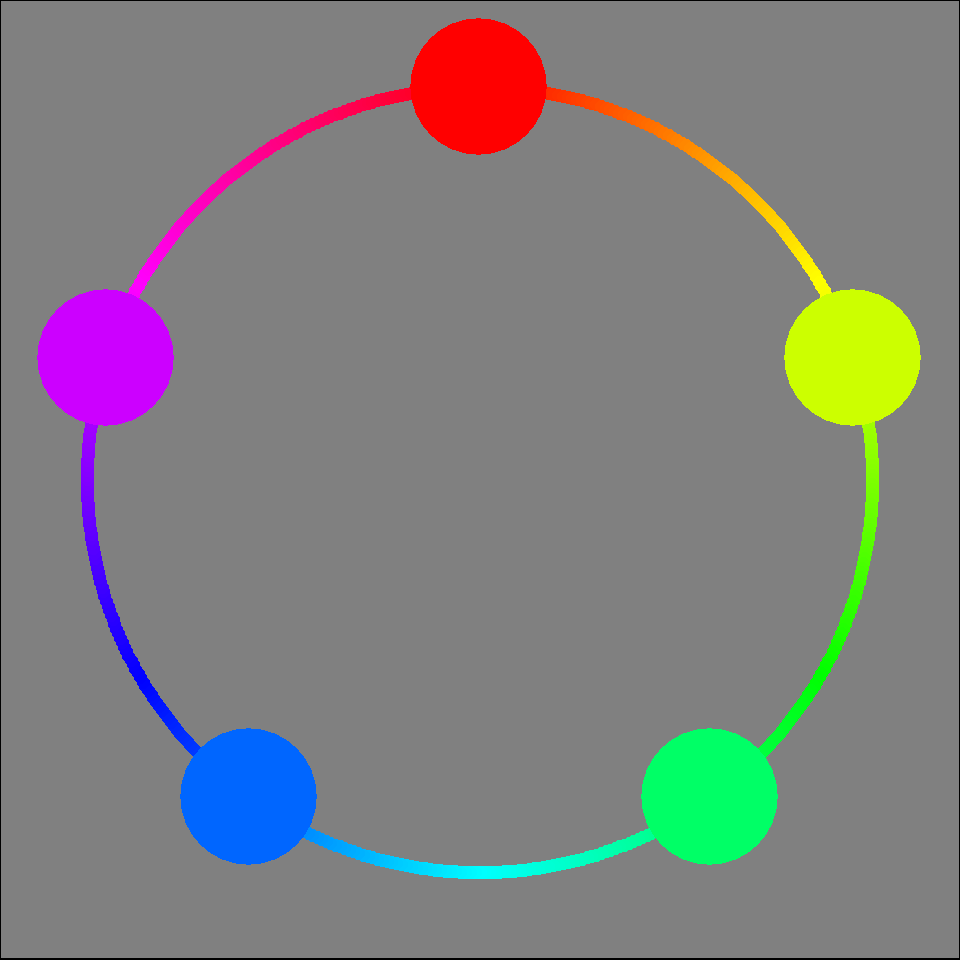
An example of a poor color choice
Food inspections
Barbershop music
Smart quotes, em dashes, and en dashes
Proposed talk on secondary data analysis
Artist wanted, here are the details
PROC-X.com. An online (unofficial) SAS journal – written by bloggers
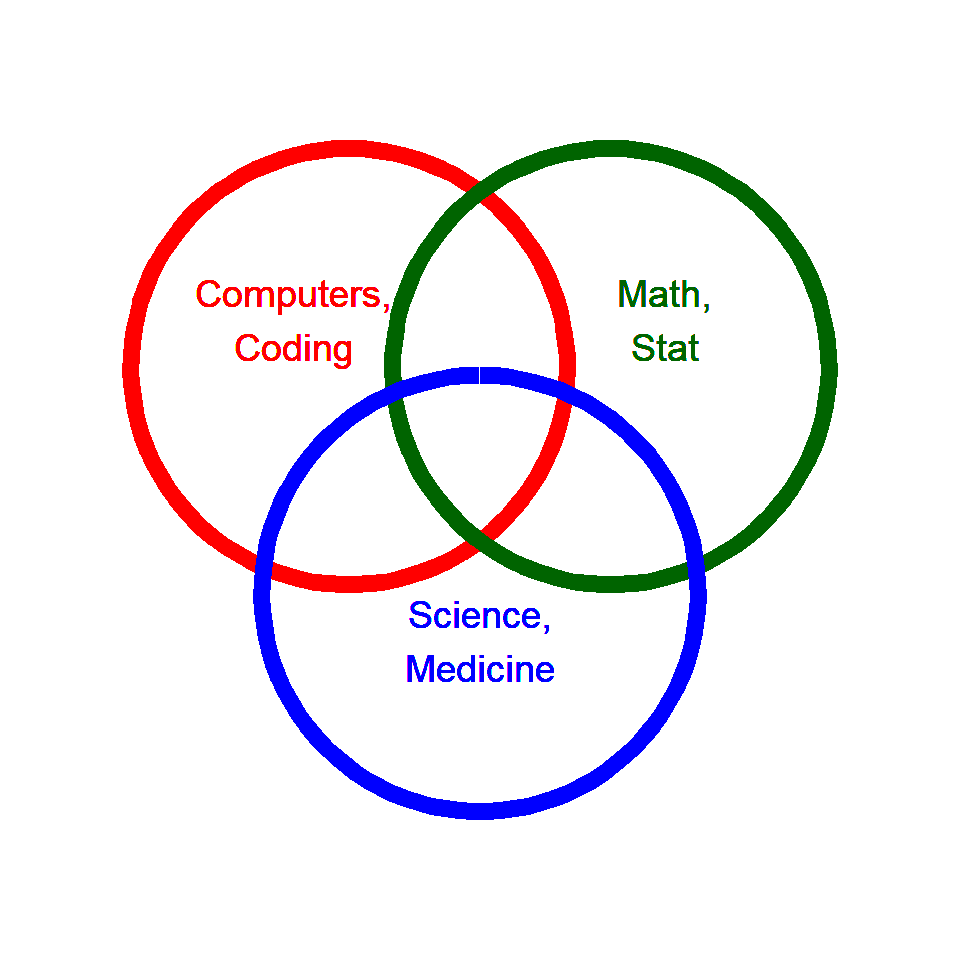
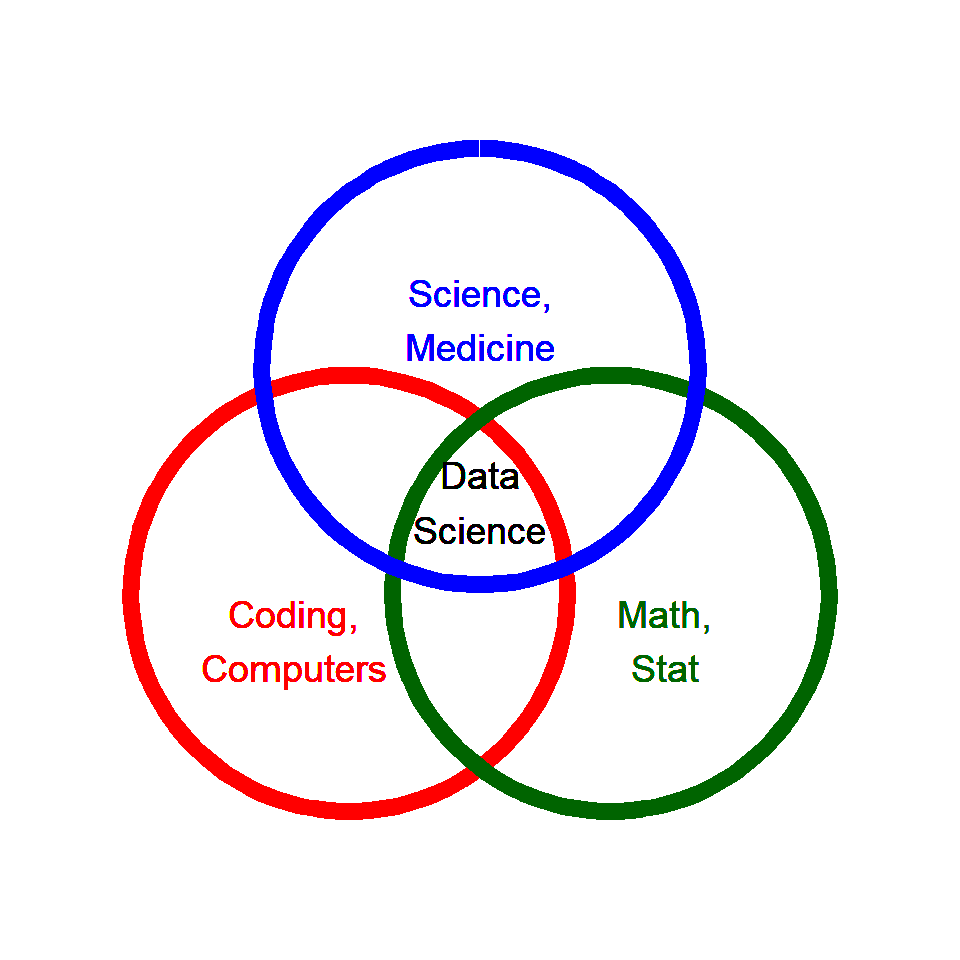
Data science curriculum roadmap
Bibliographies and citations (in R Markdown)
Separating Unique and Duplicated Observations Using PROC SORT in SAS 9.3 and Newer Versions
Writing a discussion section: how to integrate substantive and statistical expertise
Copyright and Data
Case for omitting tied observations in the two-sample t-test and the Wilcoxon-Mann-Whitney Test
Ethical Practice in Data Mining
Data Science Has Become About Lending False Credibility To Decisions We’ve Already Made
A systematic review shows no performance benefit of machine learning over logistic regression for clinical prediction models
LaTeX/Mathematics
R Markdown Basics
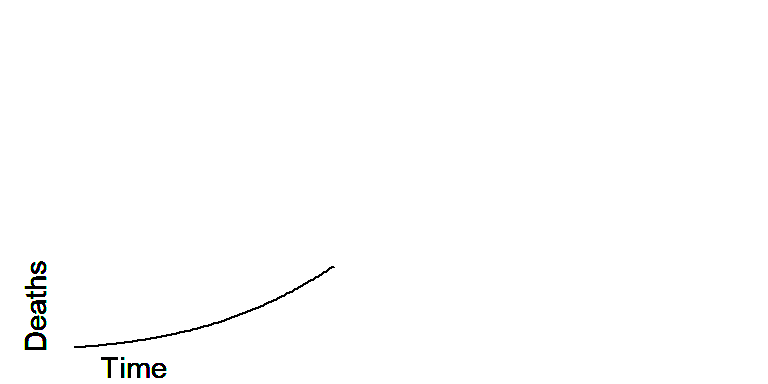
Stop Saying ‘Exponential.’ Sincerely, a Math Nerd.
All scientific work is incomplete
Make a loud mistake
Quality Improvement in Healthcare
8 Waste Types of DOWNTIME
HEDIS and Performance Measurement
Should you blow the whistle?
Think positively - what has research done for us
How to write a literature review
Citing one of my web pages
How a Feel-Good AI Story Went Wrong in Flint
Convert PowerPoint Slides to xaringan (remark.js) Slides
In UC’s battle with the world’s largest scientific publisher, the future of information is at stake
Make PowerPoint Presentations with R Markdown
Fighting SASism
Accessible R Markdown Documents
Cleaning Words with R
A top Cornell food researcher has had 13 studies retracted. That’s a lot.
Call R from SPSS
False-Positive Psychology
Use of Electronic Health Record Data in Clinical Investigations. Guidance for Industry
Next-generation phenotyping of electronic health records
JupyterLab is Ready for Users
lavaan tutorial
Leaflet - an open source Javascript library for mobile-friendly interactive maps
r2d3: R Interface to D3 Visualizations
Business essentials for starting an independent consulting practice
The Dark Side of Data Science
GloVe word vector embeddings
A simple structure for documentation
A Review of Published Analyses of Case-Cohort Studies and Recommendations for Future Reporting
Grading rubric for computer assignments
Bayesian meta-analysis of two proportions in random control trials
Analysis of Pretest-Postest Designs
Interval censored data analysis
Interval regression - R data analysis examples
Adjusted survival curves
Reproducible research with Stata
TinyTeX: A lightweight, cross-platform, portable, and easy-to-maintain LaTeX distribution based on TeX Live
Recommended format for homework assignments
And the least important variable is
Good Publication Practice for Communicating Company-Sponsored Medical Research: GPP3
Textbook Examples Applied Survival Analysis
Welcome to developerWorks
Peer grading in Introduction to R, SPSS, SAS
Changes to the Introduction to R, SAS, and SPSS classes
Data dictionaries
The history of Hadoop
Cleaning Words with R: Stemming, Lemmatization & Replacing with More Common Synonym
Possible webinars on consulting
My work on a CTSA grant
Hi - I’m Mike Bostock.
How to be more effective in your professional life
How to use social media in your career
Resources for R
Beanumber repository
Databases using R
Teaching precursors to data science in introductory and second courses in statistics
Intro to SQL for Data Science
When the revolution came for Amy Cuddy
The unthinking approach to borderline p-values
Get credit for your data – BMC Research Notes launches data notes
What does large mean when talking about negative values?
Randomized Controlled Trials in Health Insurance Systems
Announcing a new monthly feature: What’s going on in this graph
Good enough practices in scientific computing
Open source as a budgetary measure
Dryad Digital Repository
Greece’s troubling prosecution of its former chief statistician
Analyze Survey Data for Free
Is the staggeringly profitable business of scientific publishing bad for science?
ProbOnto
A p-value of .000
Extremely imbalanced multi-center trials
The numbers for the Science March
ROSE: A package for binary imbalanced learning
Standards and guidelines for the interpretation of sequence variants
Why be an independent consultant?
My areas of expertise
Will the baby walk away?
TSHS Resource Portal
Guidelines for Assessment and Instruction in Statistics Education College Report 2016
Why secondary data analysis takes a lot longer
A Tutorial on Loops in R
What greedy means to a geek
One small grant for me, one giant leap for Biostatisticians
Published methodological quality of randomized controlled trials does not reflect the actual quality assessed in protocols
What I need from statisticians
Changing the font size in R
Changing the font size in RStudio
Hadley Wickham, the Man Who Revolutionized R
Bad examples of data analysis are bad examples to use in teaching
The Importance of Reproducible Research in High-Throughput Biology
So you’re thinking about a systematic overview
Handling date-times in R
So you’re thinking about a pilot study
Can you recommend an introductory book on Bayesian Statistics
Recommendation: Ten Simple Rules for Effective Statistical Practice
Examining the storage format for sparse matrices in R
A megabyte is not a million bytes
Bayesian computing with INLA
Calculating 90 day readmission rates
Interpretation of Changes in Health-related Quality of Life: The Remarkable Universality of Half a Standard Deviation
Some open source Kaplan Meier curves
Reporting and methodological quality of sample size calculations in cluster randomized trials could be improved: a review
The number of subjects per variable required in linear regression analyses
PLOS ONE 2015 Reviewer Thank You
My latest short biography
Business essentials that you need to know before starting your career as an independent statistical consultant
Simulating power for a test of association in a two by two table
The Empirical Evidence of Bias in Trials Measuring Treatment Differences
My research interests
Two grumpy editorials at NEJM
Odds ratio with a zero in the table
Preprints and the Ingelfinger rule
The COMPare Project
Differences between information in registries and articles did not influence publication acceptance
The Likelihood Ratio Slide Rule poster submission
A book review of my first book
Safeguarding Patients in Clinical Trials with High Mortality Rates
How many research subjects
Nonlinear regression for the difference of two exponentials
How big is my graph?
PS: Power and Sample Size Calculation
A non-technical answer to why we need Markov Chain Monte Carlo
The pros and cons of cluster randomized trials
I want to learn (learn more) about R
Informed consent in a study without human subjects
Developing Grant Proposals: Guidelines for Statisticians Collaborating Under Limited Resources
Validating a test of diabetes
Improving Bioscience Research Reporting: The ARRIVE Guidelines for Reporting Animal Research
Equations using MathType
Acceptable response rates
Nonparametric tests for multifactor designs
Editorial (Basic and Applied Social Psychology)
Rich Data, Poor Data
P-Values
The answer is 17 years, what is the question. Understanding time lags in translational research
Analyzing ordinal salary categories
Transparent reporting of a multivariable prediction model for individual prognosis or diagnosis (TRIPOD): the TRIPOD Statement
In search of justification for the unpredictability paradox
Requiring fuel gauges. A pitch for justifying impact evaluation sample size assumptions
What Teachers Should Know about the Bootstrap: Resampling in the Undergraduate Statistics Curriculum
Cox regression in R
More Kaplan-Meier curves in R
Kaplan-Meier curves in R
Communicating Statistical Findings to Consulting Clients Operating in a Decisionmaking Climate: Best and Worst Practices
Sample size of 12 per group rule of thumb for a pilot study
Special issue–Using Big Data to Transform Care
Simple longitudinal data sets to illustrate data management
Software on my computer
Who is your authorized official?
MLPowSim software
Sample size for a study of reproducibility

History of SAS
A review of methods for missing data
Meet John Gawalt, Director of the National Center for Science and Engineering Statistics
Data doesn’t speak for itself
Not all scientific studies are created equal
Proposed outline for How to Start and Run an Independent Statistical Consulting Business
plotrix: Various plotting functions
A guide to the line style arguments for R graphics
Why randomized controlled trials fail but needn’t: 2. Failure to employ physiological statistics, or the only formula a clinician-trialist is ever likely to need (or understand!)
Savage Chickens cartoon on optimistic graphs
Resources for a workshop in R
Git can facilitate greater reproducibility and increased transparency in science
Recommendation: A Quick Guide for Developing Effective Bioinformatics Programming Skills
Some simple examples of manipulating the axes in a graph
The qqplot
Comparison of Logistic Regression versus Propensity Score When the Number of Events Is Low and There Are Multiple Confounders
The riddle of experience vs. memory
You can now register for an account on my blog.
Row over breast cancer screening shows that scientists bring some subjectivity into their work.
Blog is up and ready for testing
Twenty tips for interpreting scientific claims
Testing an R function
Hedging your bets on an informative prior
Running JAGS from R, a simple example
Confusion about BUGS
Developing a computer program using modern methods
Sample chapter: The first three steps in a descriptive data analysis

R code for estimating the sample size of a clinical trial with a fixed duration
How do you compute an adjusted probability?
The confidence interval for my odds ratio is too narrow!
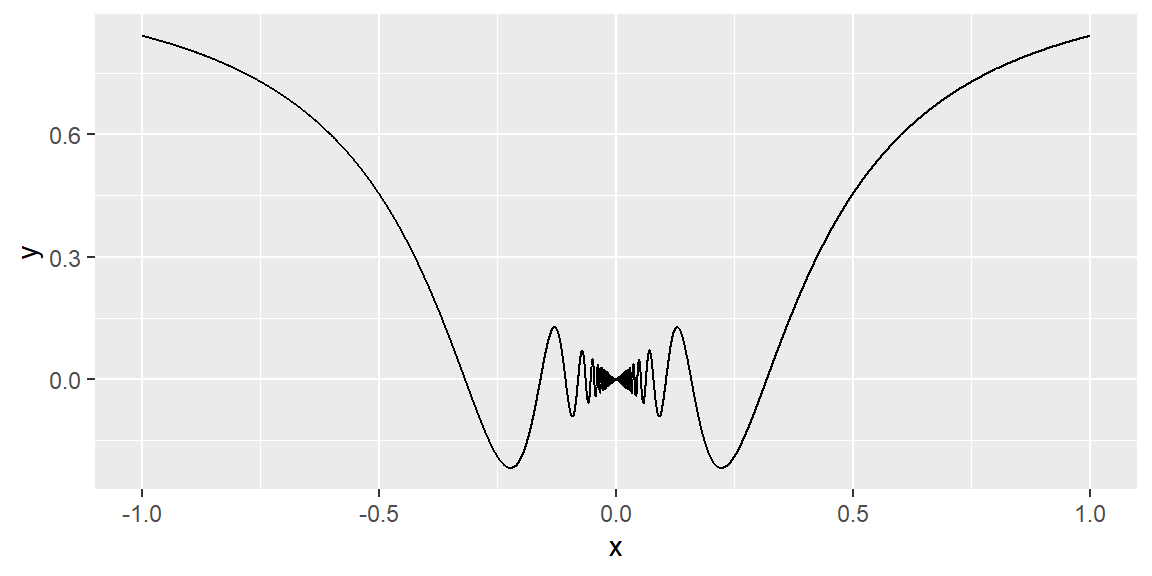
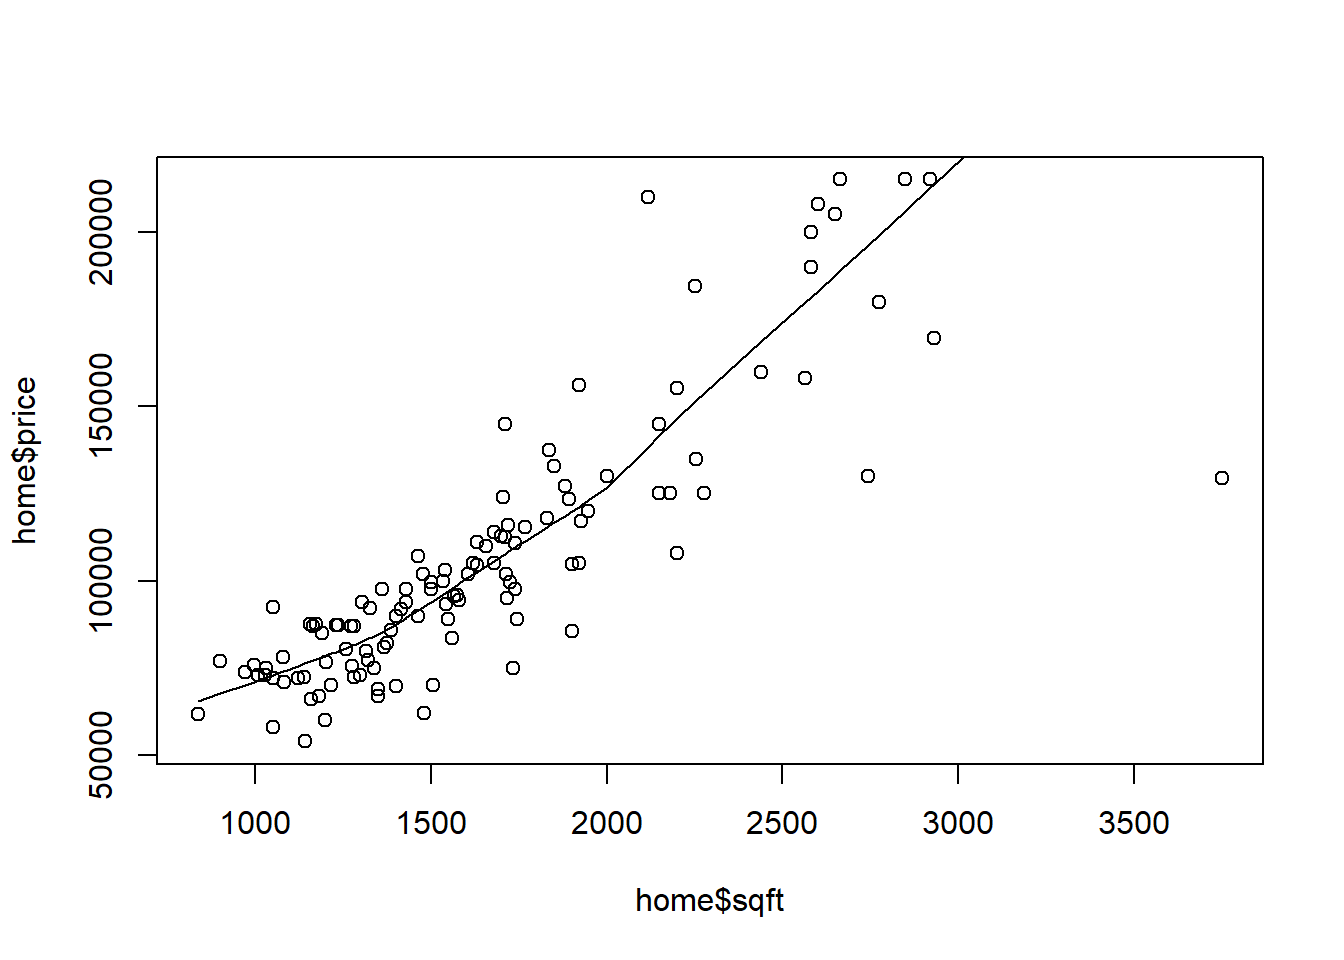
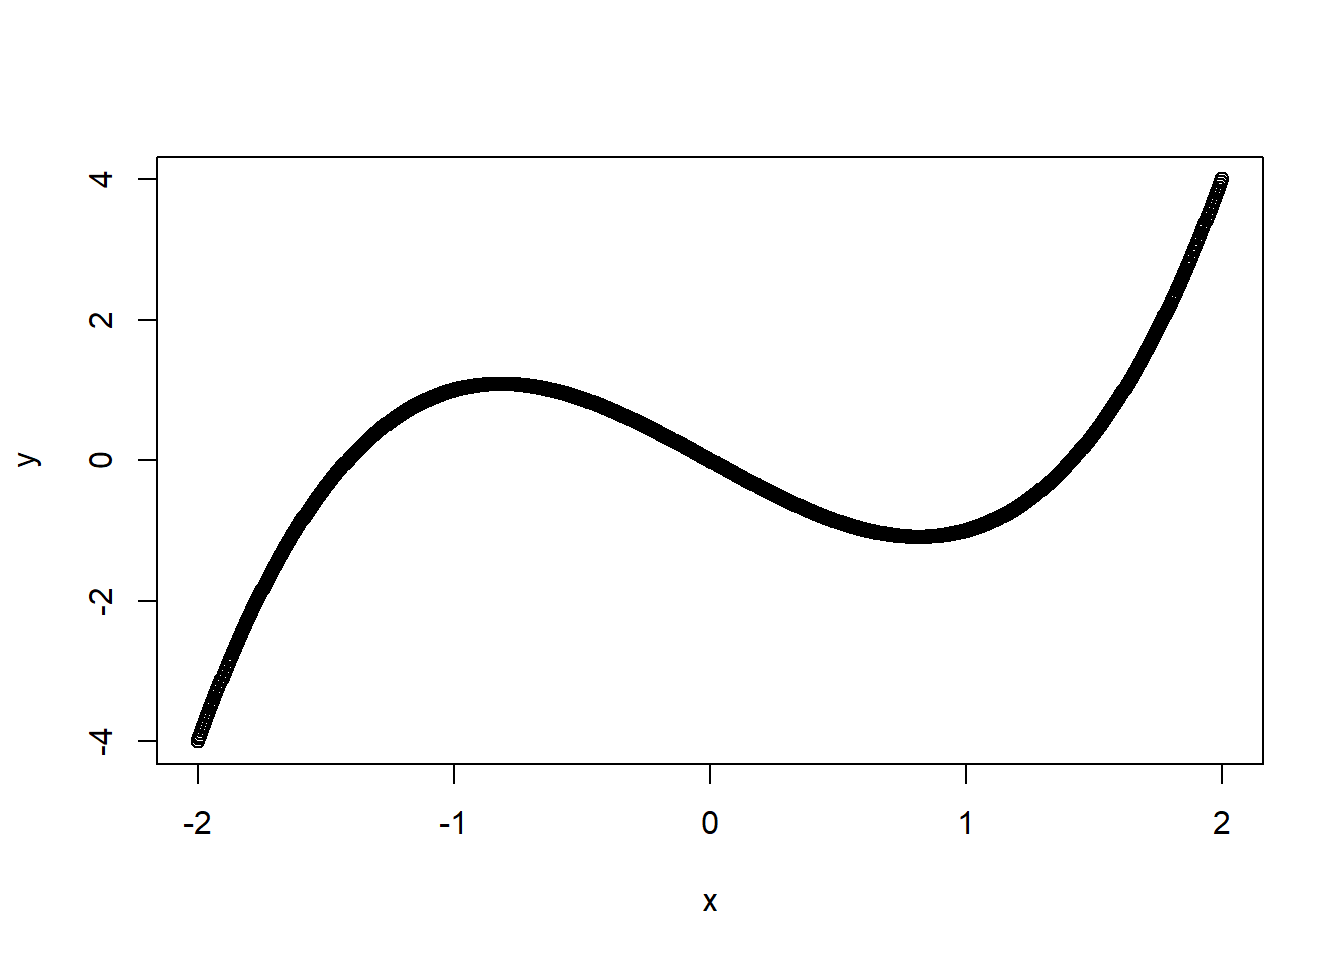
Deciphering a non-linear curve
Counting squares
Elbow model for accrual
Elbow model for accrual
Animations in R
Data sharing
Lasso talk
Lasso talk, figure 1
Lasso talk, figure 2
Lasso talk, figure 3
Lasso talk, figure 4
Lasso talk, figure 5
Lasso talk, figure 6
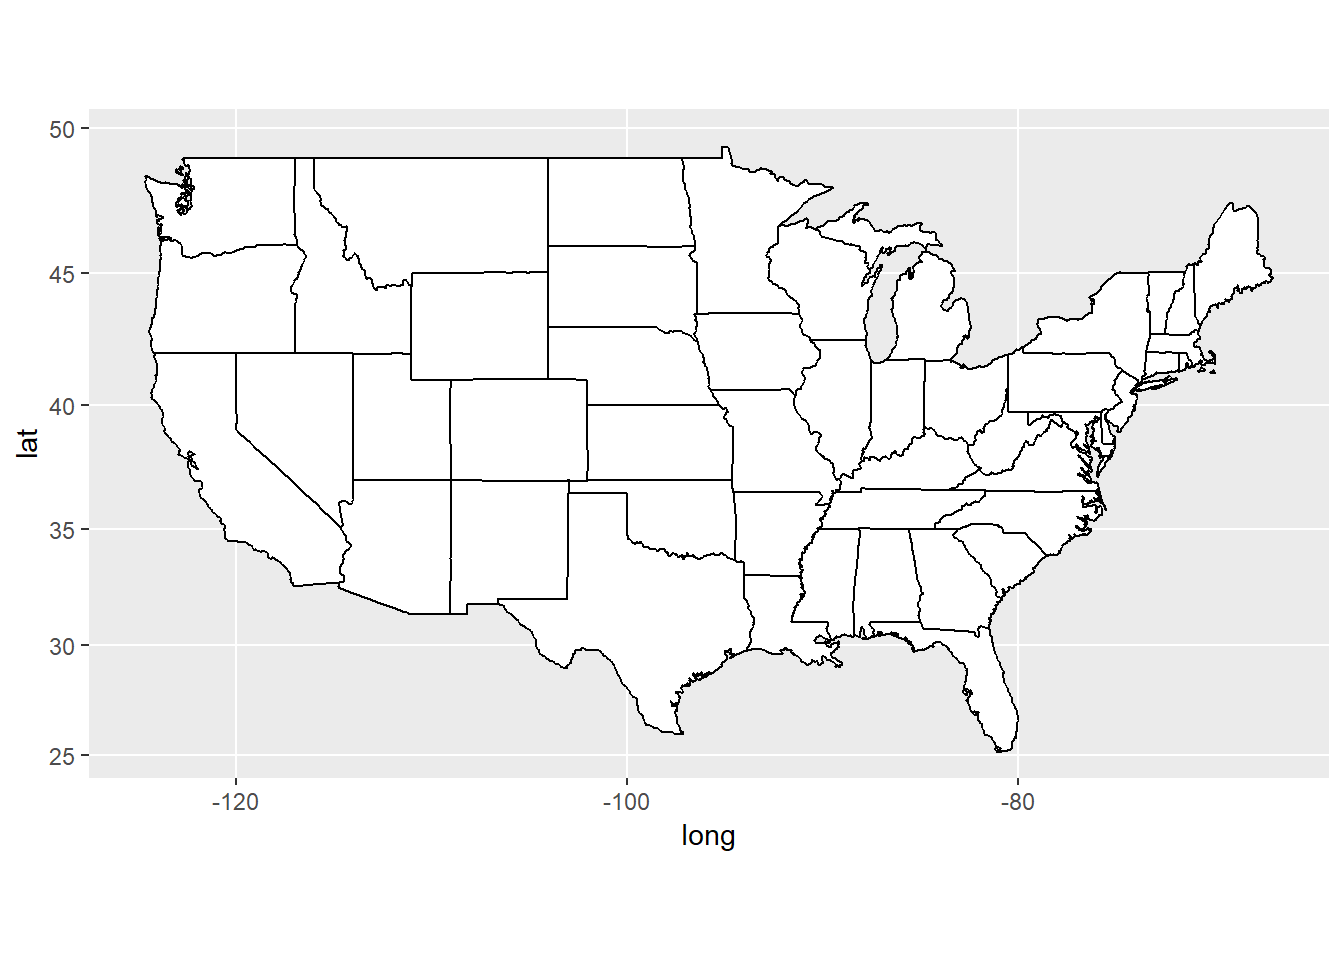
Mapping my runs in R
Are you qualified to make that comment?
Don’t write your own questionnaire
Borderline p-values
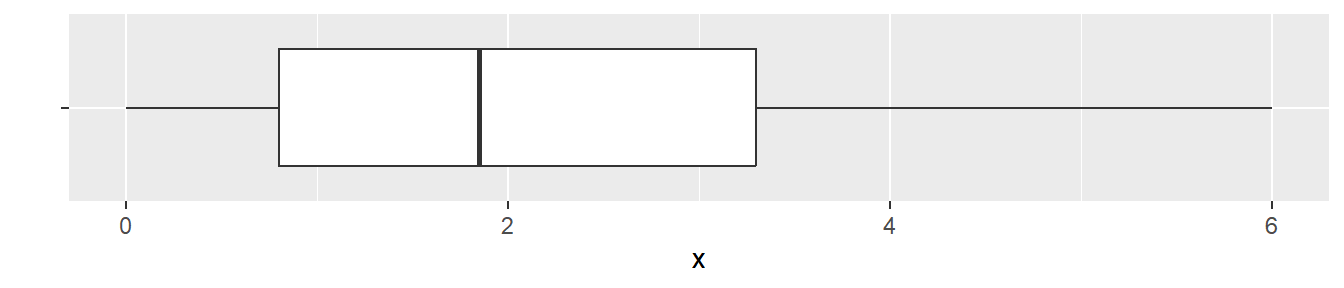
Whiskers in a boxplot
Counting pages at my old and new websites
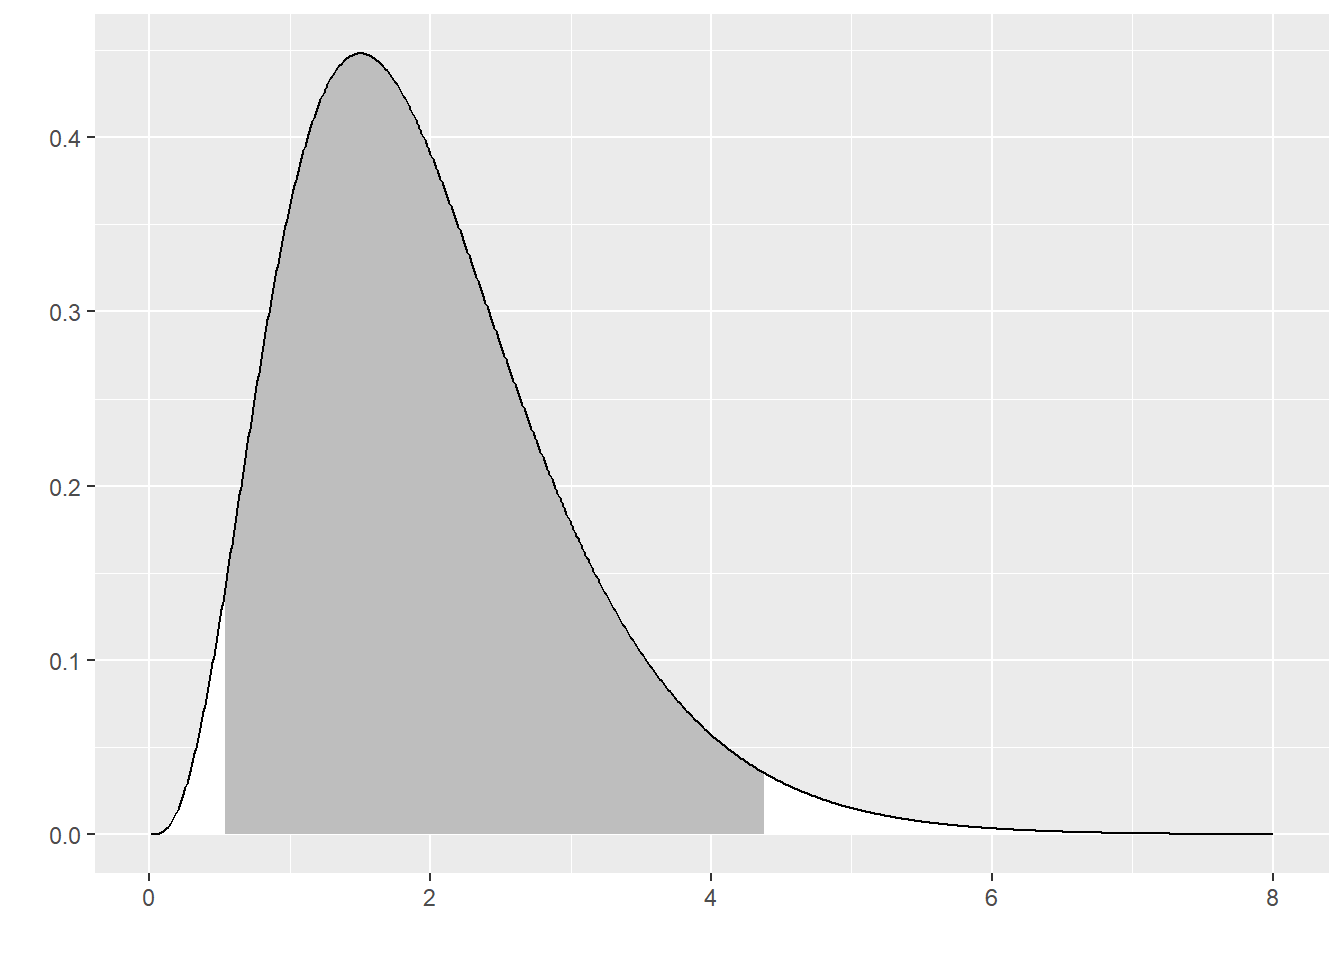
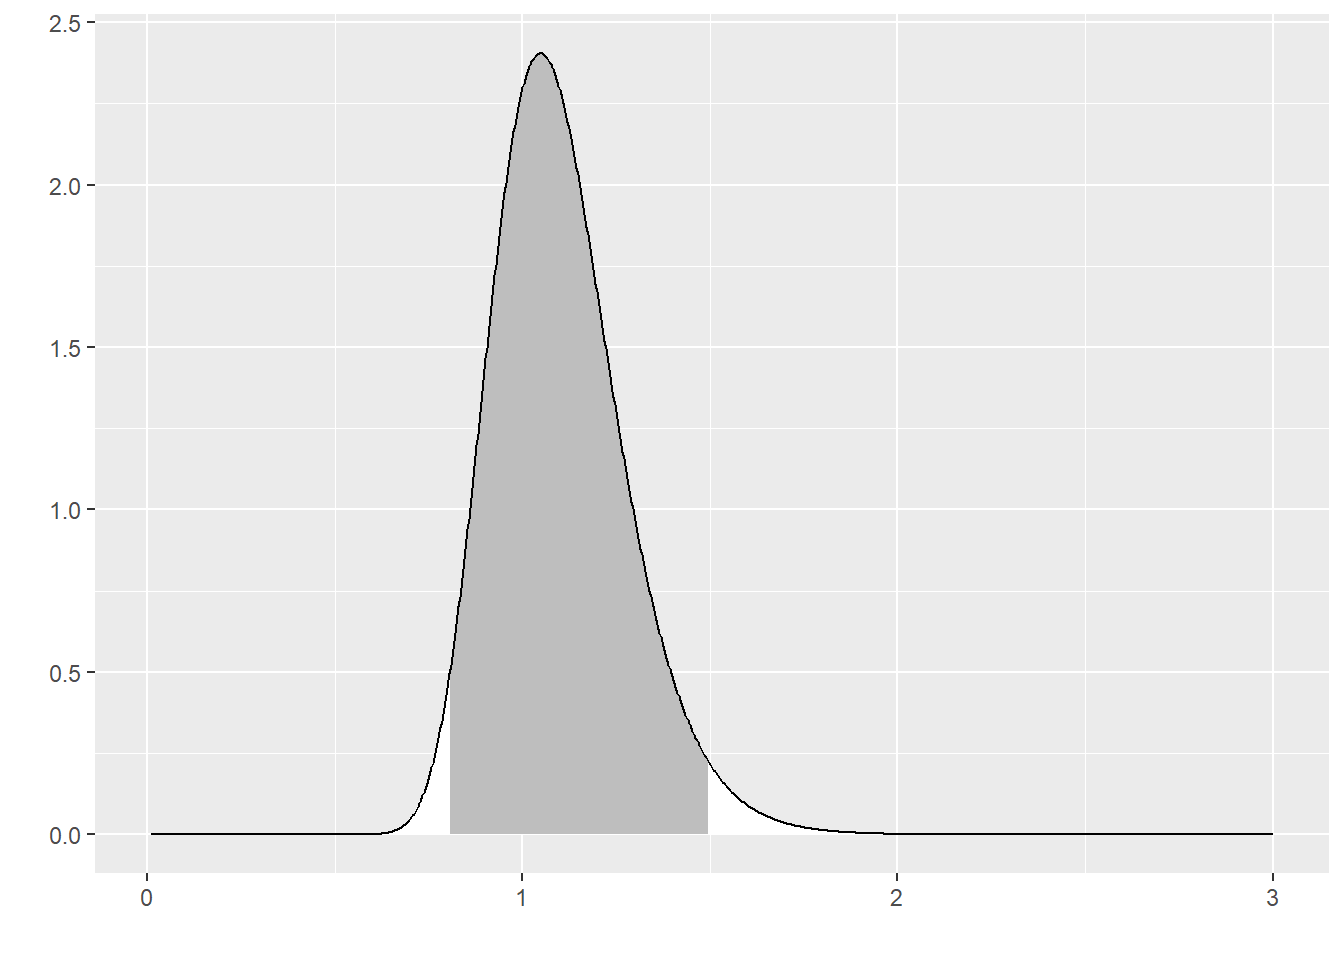
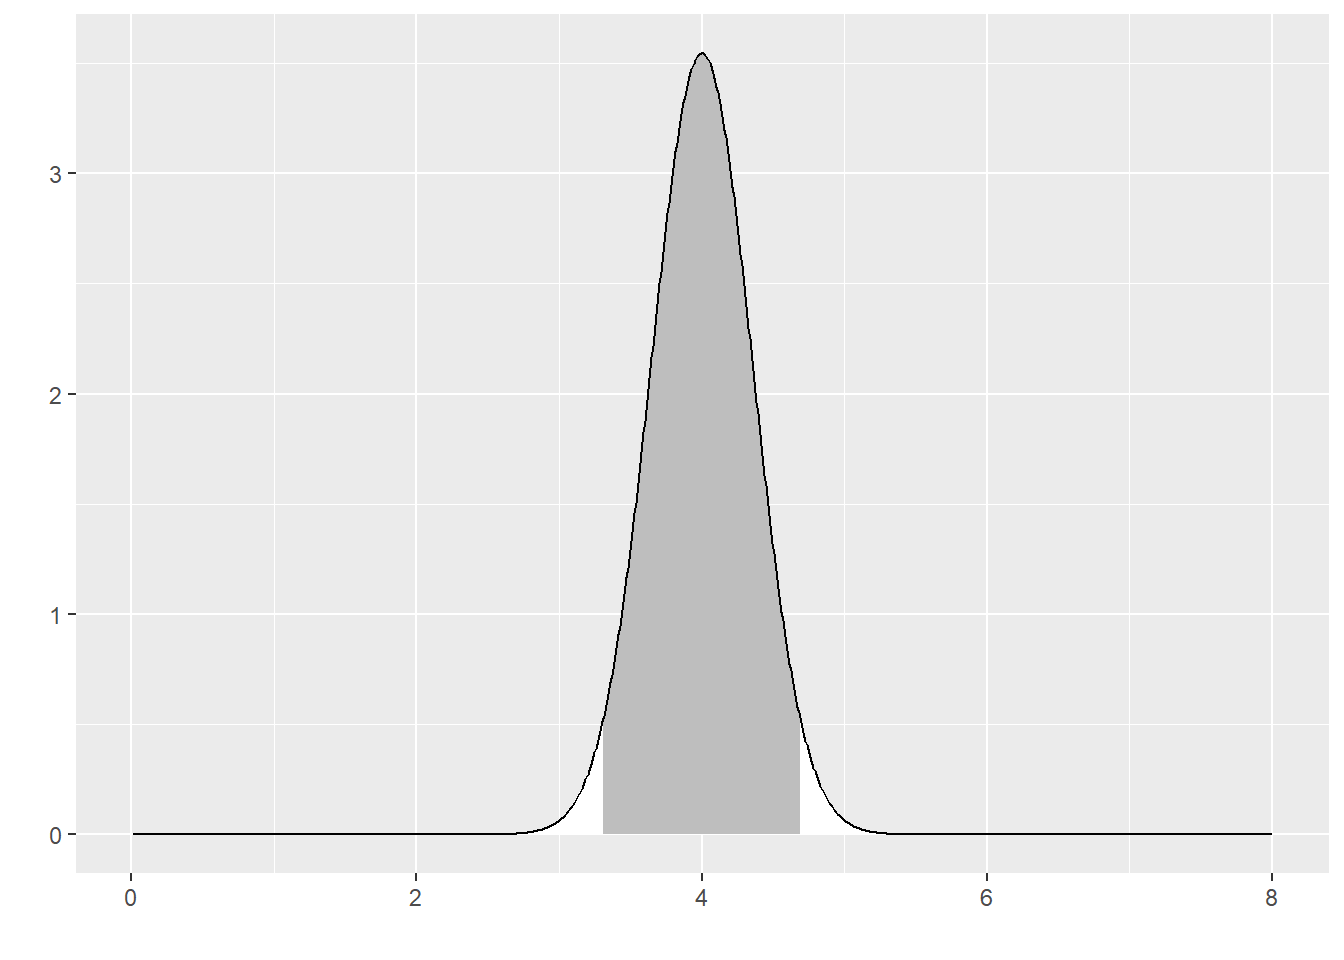
Statistical distributions borrowed from Wikipedia
What’s new
Iowa talk on accrual
Those pesky tab characters
Is sample size justification really different for animal studies compared to human studies?
A very silly graph
Author pays model
Some thoughts on a backup policy
Example abstracts for a training class
Justifying the sample size in a qualitative research study
Why is a 20% dropout rate bad?
Statistical literacy talk
What single idea will make the biggest impact on healthcare today
Statistics is more than just cutting computer code
New flat rate for consulting
Publicity for your consulting career
There’s more than one way to calculate a Fisher’s exact p-value
Teaching classes for a fee
Calculating a confidence interval for a standard deviation
Macros in Stata
Creating LaTex formulas on the fly
Location of my UMKC office
Using the Poisson distribution for modeling accrual
Closed form solution for homogenous accrual
Are certain CAM therapies undeserving of further study
Poem to help you remember the quotient rule
Transforming the parameter also transforms the prior distribution
The odds ratio in logistic regression is the opposite of what it should be
BUGS is more than just one program
Ambiguity in the definition of the exponential distribution
The Science-Based Medicine blog defends itself
Taking conflict of interest too far
Would you hire someone who knew theory
Justifying the sample size in an equivalence study
Work in pharma versus work in academia
Reconciling the various ways to calculate power for an ANOVA model
Poster presentation at the Missouri Technology conference
If you knew that failure was not an option what would you do
Why the least squares regression line has to pass through XBAR, YBAR
Putting variable names into a model automatically
Is there something better than Evidence Based Medicine out there
Oh those pesky interactions!
My new twitter account
Can you compute a confidence interval for your p-value
Using information theory to identify discrepancies within and between text files
News and announcements
Learning how to fit latent growth curve in Amos
Is Evidence-Based Medicine too rigid
What is a Generalized Estimating Equations Model
What is principal components analysis?
Competing books to the book I am planning to write
What should clients get from you at the end of your first consulting session
Glossary for my second book
What’s a fair price for SPSS?
Fighting the claim that any size difference is clinically important
Standard operating procedures for a statistical consulting center
Acknowledgments for my second book
Pooling different measures of risk in a meta-analysis
Sample chapter: The first three steps in selecting an appropriate sample size

Tentative table of contents for my second book
Jumpstart Statistics, a proposal for my second book
Salary survey for Biostatisticians
Another counter-intuitive probability problem
Can political questions be resolved by science
Resources using Stack Overflow
Classic references in Statistics
The SPSS t-test is confusing
What I use for talks instead of Powerpoint
Fitting a new class of nonlinear regression models
What I use for talks instead of Powerpoint
The futility of small sample sizes for evaluating a binary outcome
An example of a bad survey
An interesting alternative to power calculattions
Minimum sample size needed for a time series prediction
Computing power for an interaction in linear regression
What is the premier conference for statistical consulting
Making simple modifications to a graph in SPSS
How I got started in my career as an independent statistical consultant
How do I handle criticism
How to avoid charges of plagiarism
Withdrawing from a study and taking your data with you
Lessons learned the hard way: don’t throw good money after bad
More discussion on instrumental variables
What is a good surrogate measure for socioeconomic status
Interpreting p-values in a published abstract, part 1
Quiz about p-values
Using entropy and the surprisal value to measure the degree of agreement with the consensus finding
What makes a good website?
Should I learn R instead of SAS
Dealing with a large text file that crashes your computer
What to say when any data analysis is pointless
Ordinal surprisals
Can sex be an outcome variable?
Ordinal entropy
Finding duplicate records in a 19 million record database
Abstract submitted to Missouri Regional Life Sciences Summit
Exponential interpolation
Fan page for The Monthly Mean
Statistical Literacy for Medical Librarians
Survey of librarians in the Midcontinental Chapter of the Medical Library Association
Consulting remotely versus consulting in person
Humility is a good thing for researchers to have
What are the characteristics of a good consultant
Proposed poster for the Missouri Regional Life Sciences Summit
Finding the standard deviation for a power calculation
Facebook account
SPSS or Stata?
Where can I find free online textbooks
The first three steps in selecting an appropriate sample size
Lost page
Power calculations for comparison of Poisson counts across two groups
What is residual confounding?
My life so far, fails to meet expectations
Entering and analyzing data from a two by two table
Randomly generating simple math problems using R
Jump start statistics for beginning researchers
Rotating locations
Sneaking ineligible patients into a clinical trial
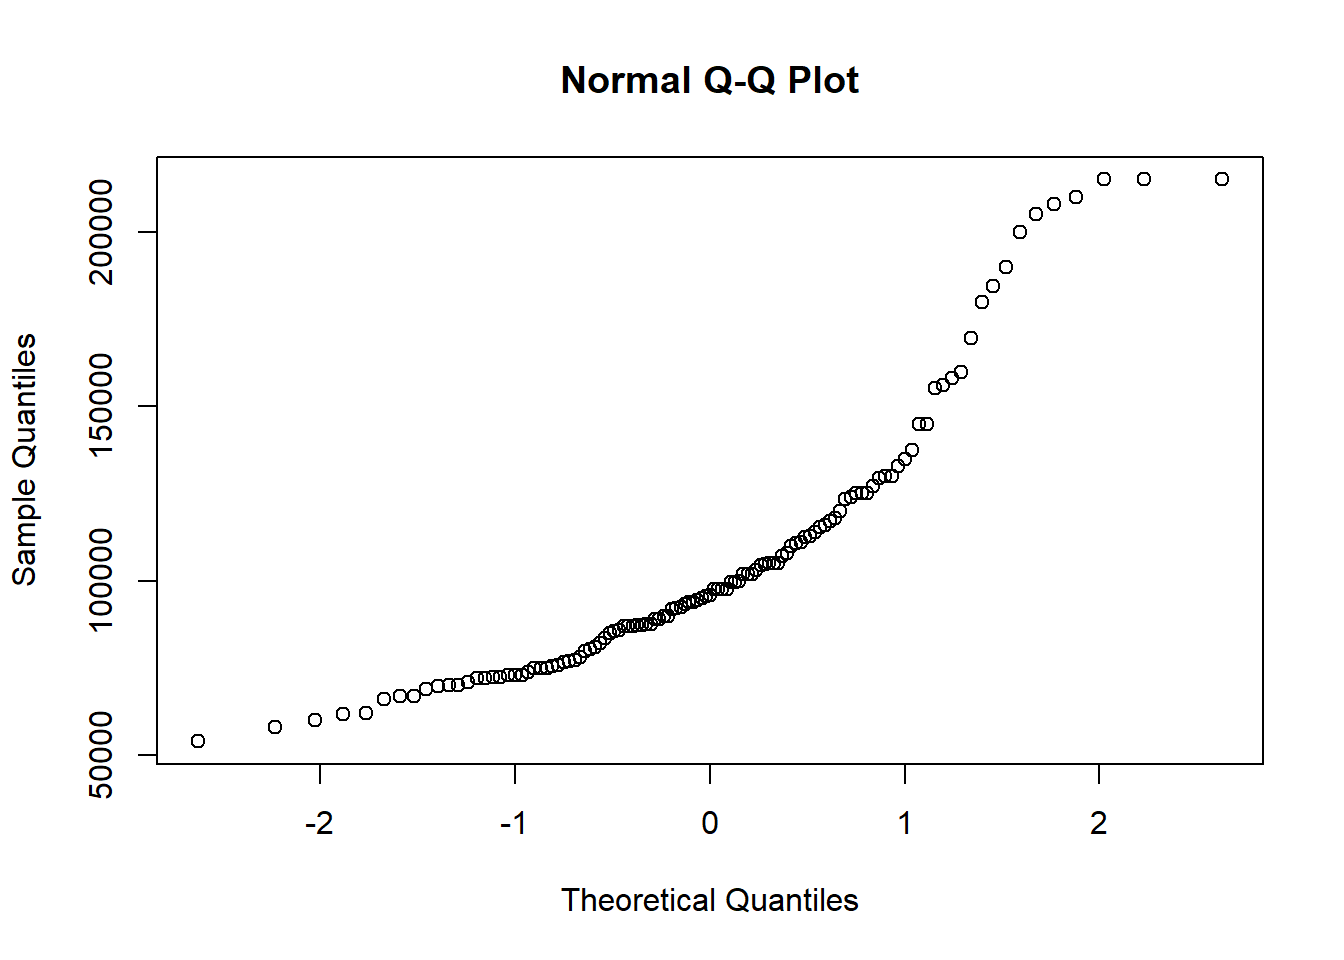
What is a normal probability plot?
Data layout for an ROC curve
Use of Likert data with ANOVA
Are we statisticians gods?
Can I stop this study?
The problem with being too sensitive
Simple longitudinal data analyses, part 1
Getting a good cut-off
Power for a three arm experiment
The controversy over standardized beta coefficients
Tentative training schedule
Standard error for an odds ratio
Formula for multiple imputation
Do multiple time points require a Bonferroni adjustment
The perils of self-evaluation
Institute of Medicine report on conflict of interest
Data that IRBs should collect about themselves
The surprisal matrix and applications to exploration of very large discrete data sets
NYTimes advice on increasing website traffic
Is this a case-control design?
Can I use you as a teaching example?
Calculating NNT for
Calculating NNT for infection rates
Two business contacts
Short biography
I love to write
Five points or seven points on a survey scale
Good papers for a journal club
Locating individual points on an ROC curve
Fewer than 10 events per variable
Interpreting a negative autocorrelation
Calibrating information
Updates for 2009
Changes in the adjusted hazard
Drawing simple mathematical graphs
A simple example of joint and conditional entropy
Maybe Powerpoint isn’t so bad
Analyzing bad data
DNA binding image
New Bioinformatics degree
A sportswriter tackles the Monty Hall problem
Developing a website logo
A false sense of frugality
Viewing SPSS and SAS output without buying SPSS and SAS
Using a sub-optimal approach in meta-analysis
Zotero, The Next Generation Research Tool
What is the Lan-DeMets approach to interim analysis
Updates for 2008
The Myth of Equipoise in Phase 1 Clinical Trials
The statistician who supposes that…
Explaining CART models in simple terms
Four assumptions of multiple regression that researchers should always test
The Myth of Equipoise in Phase 1 Clinical Trials
Reading abstracts instead of the full paper
Statisticians are not gatekeepers
Helping Doctors and Patients Make Sense of Health Statistics
Comparing a set of microarray experiments to a model experiment
Components of placebo effect, Randomised controlled trial in patients with irritable bowel syndrome
Regression with SAS. Additional coding systems for categorical variables
To be updated
A standard deviation that is too big for its own britches
Computing a difference between first and last variables
Intervening variable
Variables and hypotheses
Example of power calculation for a repeated measures design
Errors in statistical methodology
Biostatistics or Health Informatics programs in or near Kansas City
Defending Bonferroni
Interpretations for a two by two table
Normality assumptions for the paired t-test
T-test with 3 treatment values and 2 controls
Example of power calculation for a repeated measures design
A simple example of overfitting
How do I fit a piecewise linear regression
What’s new in SPSS 17
Evaluating private conflicts of interest
Comparing pre and post data with a parallel control group
Processing skip fields in SPSS
Venn diagrams with proportional areas
Links and references that I need to add
Can an outcome with three levels be used in logistic regression
Categorizing entropy values
Jackknife applied to entropy calculations
Use of entropy measures for sperm morphology classification
How do you compute a continuity correction for a confidence interval
Comparisons involving distinct groups collected at different times and with different methods
What does “population-based” mean?
Where did you get that formula for the confidence interval
Multiple email accounts
The case of Ranjit Kumar Chandra
Applying the sequence logo concept to data quality
Checks for data quality using metadata
Controversies with a test for ovarian cancer
Entropy as a measure of data quality across multiple variables
Where to look for information in a controversial area

Source for sample size formula
Is there a scientific basis for EBM?
Another inquiry about slash and burn models
Social networking as a business tool
Cumulative entropy as a measure of data quality
To be updated
Anti-intellectualism
Interval scale for count data
Reporting of adverse events
Comparing two proportions out of the same multinomial population
Resources from the Statistical Consulting Section of the American Statistical Association
Naming conventions for variables
Business aspects of an independent statistical consultant
What does the FDA think about Bayesian statistics
Should I abandon FrontPage?
Plug for accrual research
My very first meta-analysis
Godwin’s Law
Mail and calendar software I use in my new job
What distribution does this data come from
Survey results from nine out of thirty six
Where can I learn more about Statistics?
Software for bootstrap and resampling
Can I use some material from your website
Getting on and off various email lists
Hire me as a consultant
A misleading bar graph
Undeclared missing code leads
Using Google to search through my website
How to report a one-tailed Fisher’s Exact Test
Pearson correlation and ordinal data
Pearson correlation and ordinal data don’t mix
Where did that standard deviation come from
Distrust of a Bayesian
How many files
Can I run a quantitative analysis on this data?
Running R on a web server
Modeling a declining count variable
Criticism of random effects in a meta-analysis
When does heterogeneity become a concern?
Why it’s impossible to keep a resume current
How wide can you make a line of your web page?
A simple Bayesian model for
A short biography that can be used as an introduction
Why does a Bayesian approach make sense for monitoring accrual?
Slipped deadlines and sample size shortfalls in a random sample of research studies
Monitoring refusals and exclusions in a clinical trial
Directions to my new office
Nomination for the Kreamer Award for Research Excellence
Upcoming topics in Poisson regression
Evidence Based Medicine for patients
A brief overview of instrumental variables
A simple math error
What does one-third of the way through a study mean?
Calculating statistics on whole numbers
An alternative to the p-value
What sort of statistical training is needed for basic scientists?
Statistics for Boards
When a client asks for a bad analysis
Presenting unadjusted and adjusted estimates side by side
ROC curve for an imperfect gold standard
Moving content to a private site
Simplifying repeated measurements
Losing web pages in the mass of information
Calculating NNT for observational studies
Assessing the assumption of an exponential distribution
What is a critical value?
Does prevalence affect sensitivity
A simple example of a Kaplan-Meier curve
How do you analyze safety data
Finding only the important studies
What have you changed your mind about
Too much power and precision?
The post-modern assault on evidence-based medicine, part 3
High altitude effects on athletic performance
What statistic should I use when?
Type III error
I hate bad research examples
Cytel software has developed a Poisson
New format for articles, books, and websites
New personal pages
To be updated
To be updated
The glitter of…
When should you use a log transformation?
Analyzing data under an Intention to Treat model
Stair step interpolation in R
New categories needed
Open-access (OA) journals and their impact on research and the practice of medicine (created October 18, 2007
Unused resources for my open access talk
Confidence interval for a rate
Help for Statistics at UMKC and KUMC
Alphabetical bookmark list
Html debris copied from other websites
The latest word on my promotion
How many webpages have I written?
Extra information for the resume of Stephen D. Simon
Justifying the sample size for a microarray study
Bibliography of papers relating to predicting accrual in clinical trials
Conflict of interest in the Wakefield MMR study
Classic calculations for a diagnostic test
Conflict of interest list
I don’t want to use a randomized trial
Code for drawing new likelihood ratio slide rule
The debate about historical control groups
The trouble with apples and oranges
I deserve a promotion
When bad control groups happen to good researchers

Centering the data
Applying likelihood ratios in your head
May has been a slow month
Cohen’s Kappa with small cell sizes
ANOM table for alpha=0.05, part 2
Special section for quotations
What is an adequate sample size for establishing validity and reliability?
Tracking adverse events during kidney biopsy, Part 2
Reporting data analysis on transformed data
IRB review of a pilot study
What I’m working on right now
Randomly dividing a dataset in R
Ignore weak evidence at your own peril
Manipulation of peer-review publications by pharmaceutical companies
How to draw a fishbone diagram
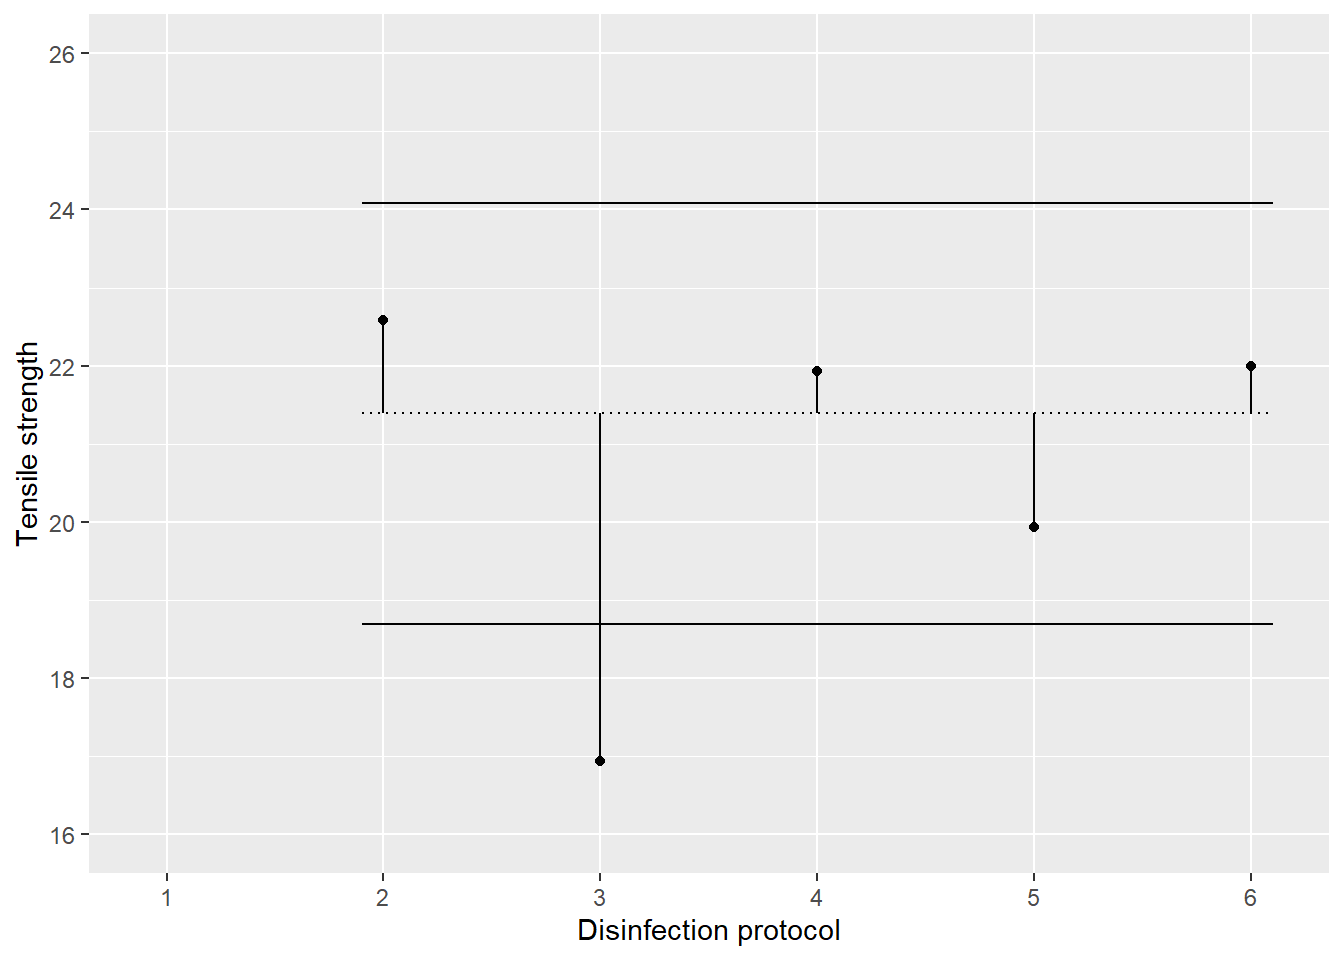
Analysis of Means answers to on your own exercises
Calculation of Analysis of Means limits
ANOM table for alpha=0.05, part 1
Analysis of Means calculations
PharmedOUT website
Calculating an XBAR-S control chart
XBAR-S control chart, answers to on your own exercise
Formulas for cumulative Poisson and binomial probabilities
Advice for searching in PubMed
When is a control chart not a control chart?
Do your own power and sample size calculations
Can Google replace your doctor?
Unusual advice about control charts
Should/Can Statistical Consultants, be Independent?
A simple Bayesian model for accrual
The danger of using humor on a web page
Medline is a very busy place
Additions and improvements to my web pages
Searching for pediatric articles on Medline
Is a 10% shortfall in sample size critical?
Is my confidence interval too wide?
Graphics options in R
Postmodern thought and evidence based medicine
To be updated
R libraries for sample size justification
My second grant
Colors for R graphs
Using a charge of fraud to achieve a political end
Applications of the CUSUM chart
Putting a human face on Evidence Based Medicine
New entry in the Chance Wiki
Interesting stuff for the month of May
Using a web site to promote your book
Always ask why
Surviving Statistical Spitting Matches
Abstainer errors in study of alcohol abuse
Blindfolded Donkey
The Busy Tailor
Ninety Nine Samples
The Only True Path
Useless Gifts
Wax Fruit
Interesting websites, publications and quotes for the month of April
Articles on Bayesian data analysis
New koan page
Examples of a fishbone diagram
Crash Course in Spss for Windows
To be updated
Software for structural equations models
To be updated
To be updated
Difficulties in generalizing
Machine Learning tools in R
The Journal of Statistical Software
First peek at the cover of my new book
Where to go, where to go
An entry in Chance News
Vote for me
Object oriented features of R
Fractions are funny
Group Sequential Monitoring of Clinical Trials in R
The HapMap project
Withholding information
Hard learned lessons
Slow progress on my weblog
Stepwise regression to screen for covariates
Web page for Fisher’s Exact test
Non-destructive data editing
Seventeen years between research and practice
Searching for information about the molasses with milk enema
The fate of retracted articles
A nonspecific diagnostic test
Discovering gene information using OMIM
Responding to a critique of meta-analysis
Sample size for a binomial confidence interval
HIPAA and research
An error slips through the peer review process
All models are
Dishonesty in medical research
Free statistics software
Testing for bimodality
Self experimentation
Science mentoring
Two articles debating equipoise
Quality control exercises
Another disaster averted
Contacting and working with me
Sample size for a binary endpoint
IRBs and scientific validity
All scientific work…
Reporting of adverse events
Converting an odds ratio to a relative risk
Effective communication about randomized clinical trials (created 2005-02-22)
Allegations of scientific misconduct (August 1, 2005)
An inefficient approach to randomization (August 10, 2005)
More on the weaknesses of randomized trials (created 2005-02-14)
S-PLUS Clinical Safety Miner (March 10, 2005, Model, Software)
Publication in the ChanceWiki
Information content of a continuous distribution
Overview of evidence-based-medicine
Expected value and moments
Moving R objects
Merging in R
Registration of clinical trials
More on regular expressions
Counterpoint on Google Scholar
Confidence interval for a correlation coefficient
What does a 60% drop mean?
Step-down procedures for multiple comparisons
Some articles on meta-analysis
More on the retroactive prayer study
Ten research studies that anyone teaching EBM should be familiar with (January 17, 2005)
When can I stop my CQI study?
Taking charges of conflicting interest too far
The paired availability design
Changes to STAT-L/sci.stat.consult
When one group only has a single observation
Another open site closes
Adjusting for covariate imbalance
Computing normal probabilities
What is critical thinking?
Geometric distribution
You have to make a distinction between the science and the technological applications
Hedge’s G
Post hoc power is never justified
Confidence intervals around a safety level
String manipulations in R
Preserving spacing in html code
Searching the literature
Meta-analysis talk
PubMed tags
Determining the optimal threshold for a diagnostic test

Searching the Internet
MedStats discussion group

Measuring agreement
Incidence density ratio
S-plus version 7
Profile analysis and MANOVA
Fair Use of copyrighted material
Presenting Numbers, Tables, and Charts
Tolerance limits
Do I have enough data after 24 months of time?
Summing ordinal data
Where is the confidence interval?
Non-random samples
Inferential and descriptive statistics
More on information theory models
Surrogate outcomes
A collection of randomized and non-randomized studies
Coming soon!
Meta-analysis for a diagnostic test
Language resources
Using Mathematica and Matlab for Statistics
Stratified Cox regression models
Meta-analysis
Digitizing a graph
Quality of published research
Publicon software
Selective reporting of research findings
Clinical importance
Cumulative meta-analysis
Technology to end spam
Sample size calculation for a nonparametric test
PowerPoint Counterpoint
The costs of a false positive test
Growth curves
Adjusting for a baseline measurement
More on the top ten studies in EBM
Taguchi methods
Security tends to be
Developing good practice guidelines
Report cards
Side effects of Cox-2 inhibitors
Moderator variables
Public access to publications from NIH-funded research
Optimization using the MM algorithm
Continuous variables in a logistic regression model
Sampling the entire population
A surprising application of the harmonic mean
Statistical Evidence in Medical Trials
Steps in a typical Bayesian model
Twas the night before surgery
How good is your intuition?
Summary Receiver Operating Characteristic Curve
The Digital Object Identifier
More thoughts on equipoise
Small relative risks
Forest plots
Odds ratios less than one
Spectrum Bias
Monetary incentives
What alternative medicine can teach us about evidence-based medicine
Media interview tips
The S+ CorrelatedData Library (May 19, 2005)
Testing for side effects
Weblinks for December 2004
Zhenya
Designing a questionnaire
Outcomes research
Design and analysis of pilot studies
Zhenya
Subgroup analysis
Neyman bias
Confidence intervals
Lost page
Rates versus proportions
More on information theory models
So you want to volunteer for a research study?
Bluejacket Toastmasters speech
Adaptive randomization
Early stopping in an animal study
Nonlinear Least Squares in S-plus and R
Excluding placebo responders
Lost page
Data Mining with Clementine
What is information theory
Sample size calculation example
Information Theory Models
Information Theory Examples
Notes from JSM 2004
Information Theory
Acuity microarray analysis software.
Steps in a typical microarray analysis
Steps for establishing a quality control program
Central Limit Theorem
Enumerative and Analytic Studies
Steps in establishing validity/reliability
Deaf chairs, lost cake recipes, and a letter from Maria.
Recent updates
Steps in a typical equivalence data analysis
Accuracy of computations
Data is/are
Steps in a typical data mining model
Mean or median?
Pitch the pie! Ban the bar!
Skewed data
Cluster randomization
Cluster randomization
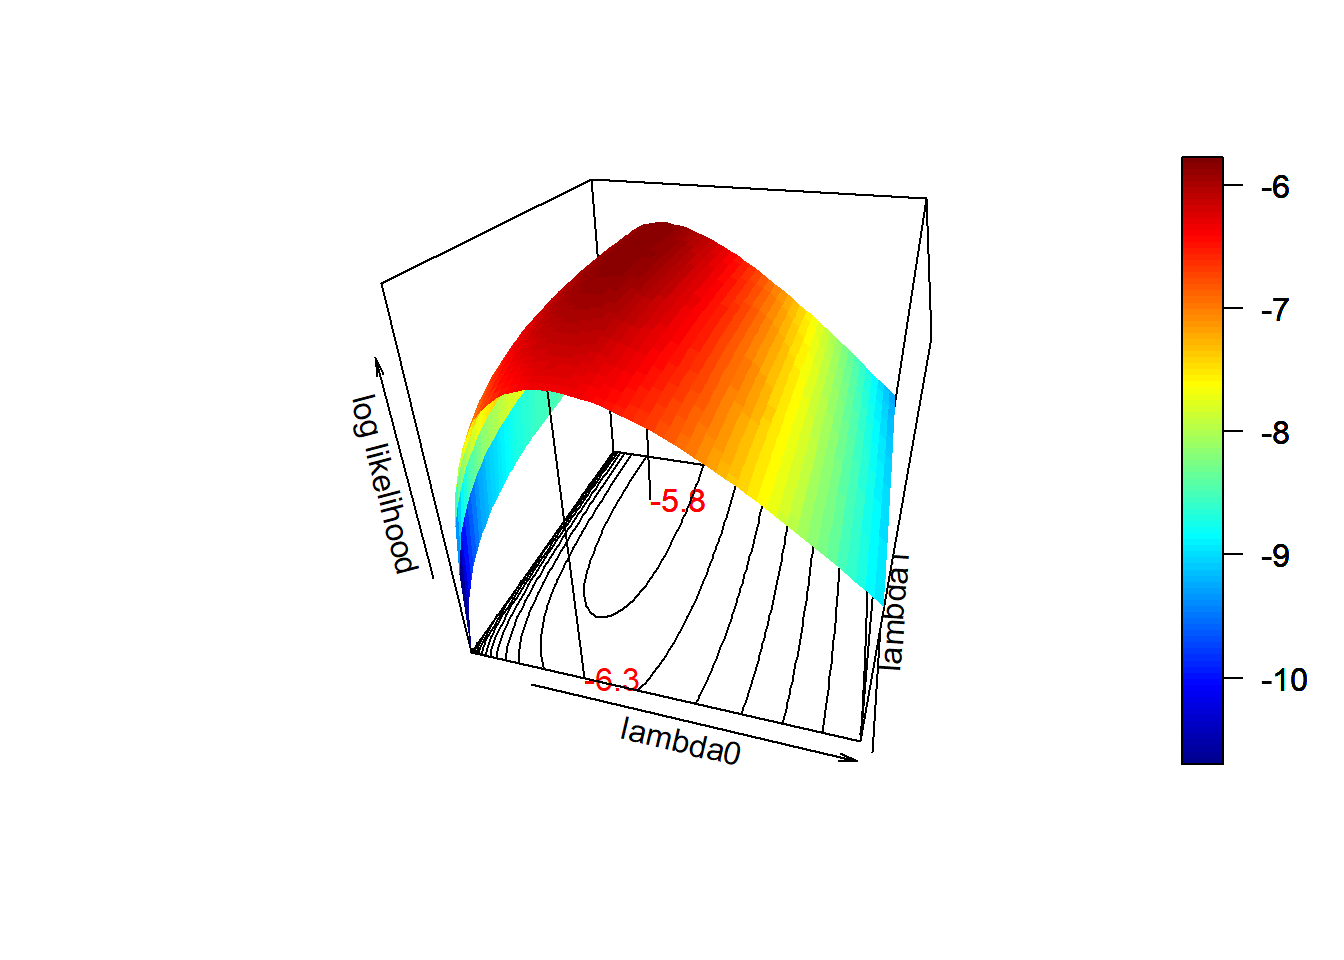
Maximum likelihood estimation

Maximum likelihood estimation
Obsolete! CMH Consulting Services
Coding race/ethnicity
Displaying tables of percentages
Likelihood ratio slide rule
Log transformation
Steps in a typical survival data analysis
Getting IRB approval for your research
Checking the assumption of normality
Data management for survival data
Exploring interactions in a linear regression model
The concepts behind the logistic regression model
SPSS dialog boxes for logistic regression
Privacy concerns in research
Interpreting coefficients in a linear regression model
Why 95% confidence limits?
SPSS citation
Stopping a study early
Establishing validity and reliability
Statistical Training Opportunities At Children’s Mercy Hospital
Unequal group sizes
BMJ letter
Problems with a very small sample
Steps in a descriptive model
Parametric versus nonparametric tests
Web polls
Loading ODBC drivers from the Microsoft Data Access Pack
The minimal impact of population size on power and precision
Writing the methods section of your grant
Odds ratio versus relative risk
Documenting negative results in a research paper
Ethics of a placebo group
Quick sample size calculations
Three things you need for a power calculation
Sample size for the Mann-Whitney U test
Software used to create these web pages.
Binary outcome sample size calculations
Stratified random sample.
Fisher’s Exact Test
Alternating treatments
What is the Kaplan Meier curve?
Links from other sites
Exporting SPSS graphs and tables.
Quota stratified random sampling.
Outliers
Spreadsheet or Database?
Association versus causation
Sigma in the control chart.
Regression to the mean
Jargon in Statistics
Bootstrap
What is collinearity?
Intention to treat
Mixture models
Number Needed to Treat
Splines
Stein’s paradox
Best fitting curve
Sample size for a confidence interval
Copyright
Future work on this website
Obsolete webpages
Information about myself
My resume
Circular data models

Meta-analysis for a diagnostic

Meta-analysis for a diagnostic
Longitudinal data analysis

Guidelines for logistic regression models

Steps in a typical linear regression analysis

Poisson regression model

Importing spreadsheet data into SPSS

Documenting your SPSS data sets

Modifying SPSS data

Inputting a two-by-two table into SPSS
Writing a research grant
Interim analysis
Type II error
Asymmetric confidence intervals

Sample size for a diagnostic study
General guide to data entry
Pilot study
Bonferroni correction
Chi-squared test
Degrees of Freedom
E notation
Page’s test

ROC curve
All or nothing
Date calculations in SPSS
Importing database files into SPSS
Developing a research hypothesis

How to randomize

R-squared
