Through the effort of a team of statisticians with the American Statistical Association, the New York Times is producing a new resource for educators called “What’s Going On in This Graph?”. This is similar to another New York Times effort called “What’s Going On in This Picture?”
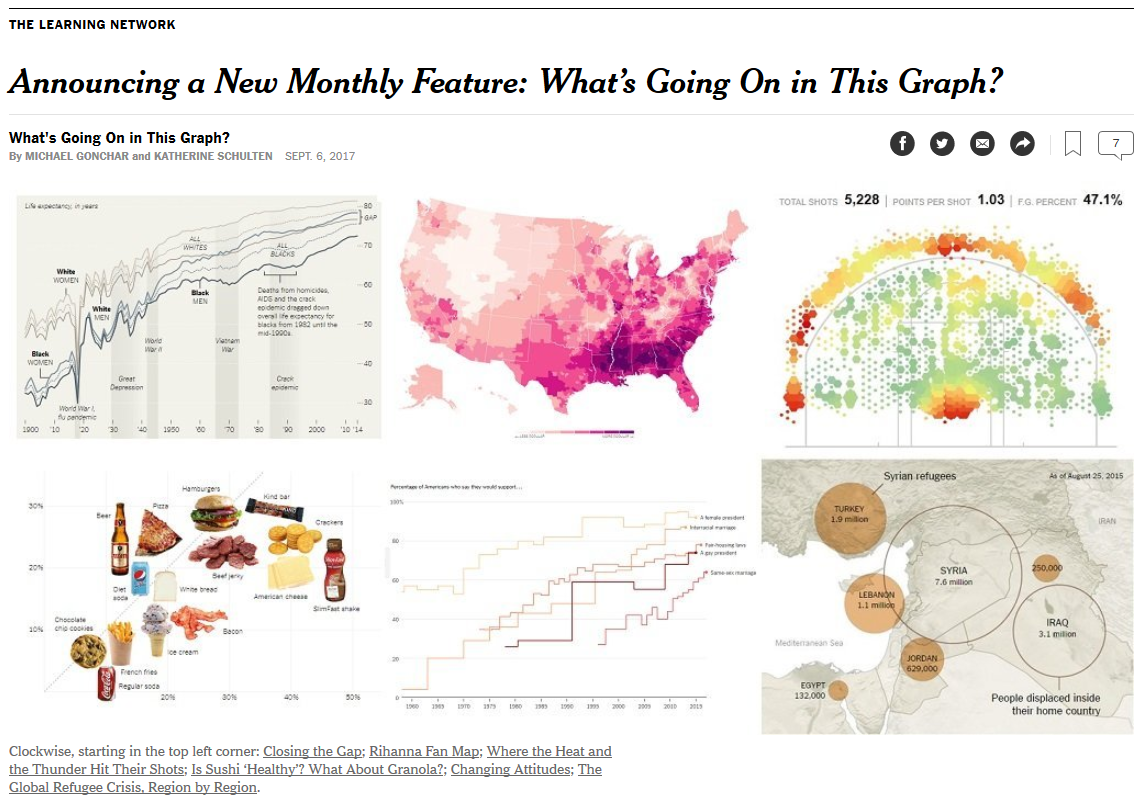
Every month the New York Times will publish a graph stripped of some key information and ask three questions: What do you notice? What do you wonder? and What do you think is going on in this graph?
The content will be suitable for middle school and high school students, but I suspect that even college students will find the exercise interesting.
The first graph will appear on September 19 and on the second Tuesday of every month afterwards.
Michael Gonchar and Katherine Schulten. Announcing a new monthly feature: What’s going on in this graph. The New York Times, September 6, 2017. Available in [html format][nyti1].