
[The Monthly Mean] January 2013--This is the International Year of Statistics. Released 2013-02-05.
Welcome to the Monthly Mean newsletter for January 2013. The Monthly Mean is a newsletter with articles about Statistics with occasional forays into research ethics and evidence based medicine. If you are having trouble reading this newsletter in your email system, please go to www.pmean.com/news/201301.html. If you are not yet subscribed to this newsletter, you can sign on at www.pmean.com/news. If you no longer wish to receive this newsletter, there is a link to unsubscribe at the bottom of this email. Here's a list of topics.
--> This is the International Year of Statistics
--> Monthly Mean article: 7 Deadly Sins Of Big Data Users
--> Monthly Mean definition: What is collinearity?
--> Monthly Mean Trivia Question: What Beatles song...
--> Monthly Mean Website: All Trials | All Trials Registered. All Results Reported
--> Nick News: Nick breaks 100 at bowling...twice!
--> Very bad joke: When I get a bank statement...
--> Tell me what you think.
--> Join me on Facebook, LinkedIn and Twitter
--> Permission to re-use any of the material in this newsletter
--> This is the International Year of Statistics. The year 2013 has been designated as the International Year of Statistics. Who started this?
"The founding organizations of the International Year of Statistics—also called Statistics2013—are the American Statistical Association, Institute of Mathematical Statistics, International Biometric Society, International Statistical Institute (and the Bernoulli Society), and Royal Statistical Society."
What is this all about?
"As established by the founding organizations, the campaign's primary objectives are to do the following: increase public awareness of the power and impact of statistics on all aspects of society; nurture statistics as a profession, especially among young people; and promote creativity and development in the sciences of probability and statistics."
Go to the official website (http://www.statistics2013.org/) for more information. The website includes original articles and links to articles published elsewhere.
Did you like this article? Visit http://www.pmean.com/category/TeachingResources.html for related links and pages.
--> Monthly Mean article: Jeff Bertolucci. 7 Deadly Sins Of Big Data Users Information Week, July 30, 2012. Excerpt: "We're swimming in a vast sea of data that's rising every year. And according to Josh Williams, president and chief science officer of Kontagent, a social and mobile analytics company, companies that collect, analyze, and interpret data accurately--and act upon it quickly--have a significant competitive advantage. At the Kontagent Konnect user conference in late May, Williams made a presentation called the "7 Deadly Sins of Data Science," in which he outlined the common mistakes that organizations make when processing large amounts of data. There's a good chance you're familiar one or more of the Deadly Sins, which include Sloth, Negligence, Gluttony, Polemy, Imprudence, Pride, and, of course, Torpor. " [Accessed on February 1, 2013]. http://www.informationweek.com/news/software/bi/240004501.
--> Monthly Mean definition: What is collinearity? Collinearity is a situation where there is close to a near perfect linear relationship among some or all of the independent variables in a regression model. In practical terms, this means there is some degree of redundancy or overlap among your variables.
Some authors describe this as multicollinearity, near collinearity, or ill conditioning. Coming up with four different technical terms for the same condition is one way that we statisticians keep our discipline mysterious and awe inspiring.
Collinearity can appear as a very high correlation among two independent variables, but it doesn't have to work that way. Another type of collinearity is when several of the variables add up to something that it very close to a constant value.
Collinearity is not a fatal flaw, but it does cause a loss in power and it makes interpretation more difficult.
A simple example of collinearity is when you are using both gestational age and birth weight as independent variables. These two measures are highly correlated, of course, since low gestational ages tend to be associated with low birth weights.
Interpretation is difficult in this situation, because when both variables are in a regression model, the parameter for birth weight is measuring the effect of a change in one unit in birth weight on the dependent variable, assuming that all of the other variables are held constant. It's hard to envision what it means to change birth weight while gestational age is held constant. What you are looking at, in effect, is the size of a baby for a fixed gestational age.
Collinearity also causes a loss in power. When you have overlap among some of the variables, it takes more data to disentangle the individual effects of these variables. Think of it as a table where you push two of the four legs away from the corners and close to the middle of the table. Such a table will be very unstable.
In the previous example, we have very few 1000 gram babies who are 40 weeks gestational age and very few 2500 gram babies who are 32 weeks gestational age. Without data at these two "corners" of the table, it's hard to get stable statistical estimates.
It should be noted, though, that you can make sense of your data, even when you have collinearity. It just takes more data and a bit of care in interpretation. Some health outcomes, it turns out, are related more closely to gestational age than to birth weight. It's not how small you are that is as important as how early you make your entry into the world. Keep in mind that I'm not a doctor, so check my limited knowledge of medicine out with the experts. Especially if you are a newborn baby.
Did you like this article? Visit http://www.pmean.com/category/ModelingIssues.html for related links and pages.
--> Monthly Mean Trivia Question: What Beatles song has the profound mathematical insight "One and one and one is three"? The first person to answer correctly by email gets mentioned in the next issue of The Monthly Mean.
Last month's trivia question was: This past Christmas, one of my gifts was an interesting clock. It was labelled in radians. Where you'd normally expect to see a 12, there is a value of 2pi. In place of the 1 is pi/6. What time would it be if the big hand was on pi/2 and the little hand was on 4pi/3?
P. N. Draper was the first person to provide a correct answer (8:15pm).
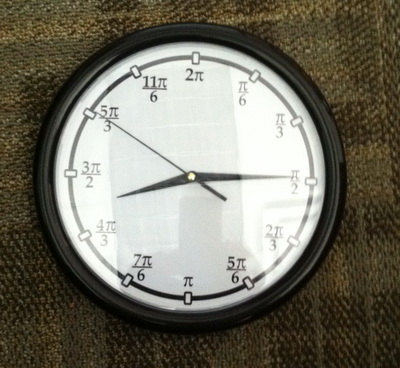
Here's a picture of the clock.
Antonio Rinaldi points out that the hour hand would never be exactly on a particular value unless you were right at the hour. So, for example, when the clock reads 8:15, the minute hand is exactly on the 3, but the hour hand would actually be a quarter of the way between the 8 and the 9. I was using the colloquial description, so my problem was indeed poorly posed. If I had placed the little hand a quarter of the way between 4 pi/3 and 3 pi/2 (11 pi/8), then that would have been more accurate.
--> Monthly Mean Website: David Tovey, Tracey Brown, Ben Goldacre, Richard Lehman, Richard Stephens, Carl Heneghan, Iain Chalmers. All Trials | All Trials Registered. All Results Reported. Excerpt: "It's time all clinical trial results are reported. Patients, researchers, pharmacists, doctors and regulators everywhere will benefit from publication of clinical trial results. Wherever you are in the world please sign the petition: Thousands of clinical trials have not reported their results; some have not even been registered. Information on what was done and what was found in these trials could be lost forever to doctors and researchers, leading to bad treatment decisions, missed opportunities for good medicine, and trials being repeated. All trials past and present should be registered, and the full methods and the results reported. We call on governments, regulators and research bodies to implement measures to achieve this." [Accessed on February 1, 2013]. http://www.alltrials.net/.
Did you like this article? Visit http://www.pmean.com/category/PublicationBias.html for related links and pages.
--> Nick News: Nick breaks 100 at bowling...twice! Nicholas enjoys bowling and he recently stopped using the bumpers that are set up to prevent gutter balls. He does still throw a gutter ball once in a while, but he is actually getting quite good. He has an unorthodox style, but he does put enough spin on the ball to make a difference (a straight ball right down the middle with no spin will almost always lead to a split). Recently, Nicholas and I were out bowling and in the first game, he led through the seventh frame. I'm not that good myself, but I pulled away with a late spare. I forget his score in the first game, but it was close to 100. The second game he started out with a strike in the very first frame and never looked back. With a couple of spares as well, he tied the record for his best score at 111. We won't say what my score was, except that it was below 111. So this represents the first time that Nicholas has beaten me in head-to-head competition. He wanted to bowl a third game, but I wasn't up for it. He volunteered to bowl for me, and he did very well again, at least when he wasn't pretending to be me. He bowled a 108, which was another very good result.
I tried to get a picture of his score, but the glare keeps you from seeing his result. Trust me, he did very well.

I think my best result ever was around 160, so he has a way to go before he tops that. But give him some more arm strength and a heavier ball and a bit more practice and I'm sure he will do it.
--> Very bad joke: When I get a bank statement, I don't try to reconcile the amount on the statement with my checkbook register that carefully. If it is within $100, I chalk up the difference to sampling error. This is an original joke of mine.
--> Tell me what you think. How did you like this newsletter? Give me some feedback by responding to this email. Unlike most newsletters where your reply goes to the bottomless bit bucket, a reply to this newsletter goes back to my main email account. Comment on anything you like, but I am especially interested in answers to the following three
questions.
--> What was the most important thing that you learned in this newsletter?
--> What was the one thing that you found confusing or difficult to follow?
--> What other topics would you like to see covered in a future newsletter?
If you send a comment, I'll mention your name and summarize what you said in the next newsletter. It's a small thank you and acknowledgement to those who take the time to help me improve my newsletter. If you send feedback and you want to remain anonymous, please let me know.
I received feedback from three people for last month's newsletter.
An anonymous reader likes the shorter emails that appear monthly. Thanks. I'll try my best to do this. That same reader liked my p for trend article. He shared some of my colleague's mistrust of that statistic, but after reading my article feels like it isn't always a cheat.
Ed Gracely shared his thoughts on Cronbach's alpha. He sees 0.5 as a bare minimum, and likes to see 0.7 or better. He mentioned Cronbach's alpha as being, in some limited cases, a pretty good estimator of test-retest reliability, but you need to proceed with great caution. He also mentioned that test-retest reliability itself needs to be treated with caution. Ed also liked the idea of shorter and more frequent newsletters.
Judy Champion shared a bad joke (I love bad jokes!). She pointed out that more frequent publication of The Monthly Mean is just an attempt to average things out.
--> Join me on Facebook, LinkedIn, and Twitter. I'm just getting started with social media. My Facebook page is www.facebook.com/pmean, my page on LinkedIn is www.linkedin.com/in/pmean, and my Twitter feed name is @profmean. If you'd like to be a Facebook friend, LinkedIn connection (my email is mail (at) pmean (dot) com), or tweet follower, I'd love to add you. If you have suggestions on how I could use these social media better, please let me know.
--> Permission to re-use any of the material in this newsletter. This newsletter is published under the Creative Commons Attribution 3.0 United States License, http://creativecommons.org/licenses/by/3.0/us/. You are free to re-use any of this material, as long as you acknowledge the original source. A link to or a mention of my main website, www.pmean.com, is sufficient attribution. If your re-use of my material is at a publicly accessible webpage, it would be nice to hear about that link, but this is optional.
What now?
Sign up for the Monthly Mean newsletter
Review the archive of Monthly Mean newsletters
Take a peek at an early draft of the next newsletter
![]() This work is licensed under a
Creative
Commons Attribution 3.0 United States License. This page was written by
Steve Simon and was last modified on
2017-06-15.
This work is licensed under a
Creative
Commons Attribution 3.0 United States License. This page was written by
Steve Simon and was last modified on
2017-06-15.