[The Monthly Mean] March/April 2011--I want to calculate power, but I don't have a standard deviation for the formula
The Monthly Mean is a newsletter with articles about Statistics with occasional forays into research ethics and evidence based medicine. I try to keep the articles non-technical, as far as that is possible in Statistics. The newsletter also includes links to interesting articles and websites. There is a very bad joke in every newsletter as well as a bit of personal news about me and my family.
Welcome to the Monthly Mean newsletter for March/April 2011. If you are having trouble reading this newsletter in your email system, please go to www.pmean.com/news/201104.html. If you are not yet subscribed to this newsletter, you can sign on at www.pmean.com/news. If you no longer wish to receive this newsletter, there is a link to unsubscribe at the bottom of this email. Here's a list of topics.
Lead article: I want to calculate power, but I don't have a standard deviation for the formula
2. Should I use a spreadsheet or a database to enter my data?
3. A binary coding trick that you can learn from Car Talk
4. Monthly Mean Article (peer reviewed): Ethical issues posed by cluster randomized trials in health research
5. Monthly Mean Article (popular press): Do Cellphones Cause Brain Cancer
6. Monthly Mean Book: Impure Science: AIDS, Activism, and the Politics of Knowledge
7. Monthly Mean Definition: What is a calibration curve?
8. Monthly Mean Quote: When I talk to people about statistics...
9. Monthly Mean Unsung Hero Award: J. Laurie Snell
10. Monthly Mean Video: The Strange Powers of the Placebo Effect
11. Monthly Mean Website: Migrating to R for SAS / SPSS / Stata Users
12. Nick News: Overnight camp with Cub Scouts
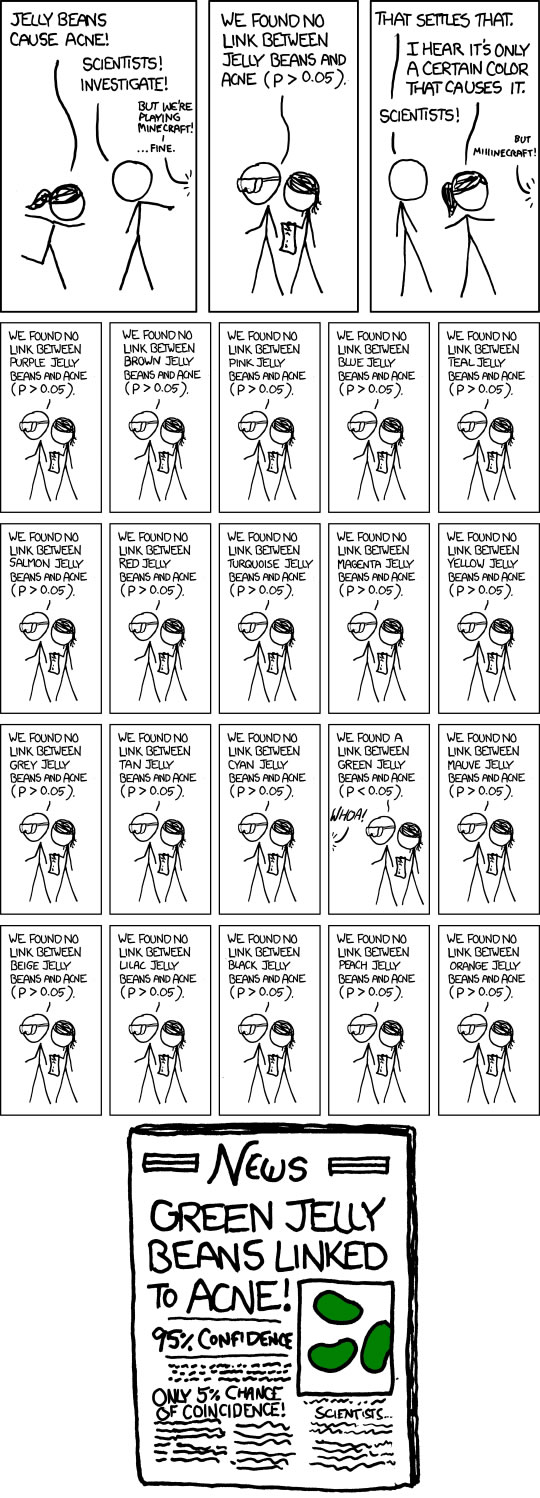
13. Very bad joke: Jelly beans cause acne! Scientists! Investigate!
14. Tell me what you think.
15. Join me on Facebook and LinkedIn
1. I want to calculate power, but I don't have a standard deviation for the formula
Someone was asking for assistance on calculating power. A research agency was willing to lend some of its data for a secondary data analysis on a large data set (1,314 observations), but it asked for anyone requesting this data to demonstrate that their hypothesis had adequate power before sharing their data. There were publications based on this data, but using different endpoints, so the person could not get the standard deviation needed for the formula for power.
One could argue that a power calculation is irrelevant when the sample size is fixed. But the organization is unlikely to buy this.
As I describe in
* www.pmean.com/01/power.html
you need three things for a power calculation. A research hypothesis, a standard deviation of your outcome measure, and the minimum clinically important difference.The research hypothesis is easy in your case. The standard deviation is harder because the papers that you have gotten, as I understand it, do not have a standard deviation for the outcome you are interested in, but rather for other outcome measures.
But it is a very rare outcome measure that has never had anything published about it. Surely some paper somewhere can provide you with that standard deviation. It's not like you're inventing totally new outcome measures that have never been studied by anyone before.
The population that these outcome measures were used on, of course, are probably quite different than the one you are proposing to use. That's always going to be an issue. Try to find a population that is not too radically different, but keep in mind that this will always be an imperfect fit.
As a worst case scenario, you can use a SWAG (look it up). If you know the range of your data, that can give you a rough idea of how big your standard deviation might be. It's impossible for a standard deviation to be 500, for example, if all of your data lies between 0 and 10.
Here's an example. Your outcome measure is birthweight. The tiniest babies are about 500 grams; anything smaller is not viable. The biggest babies are about 5000 grams, as human females are not big enough to give birth to babies much larger than this. The range is 4500 grams. Divide by 4 or 6 to get an approximate standard deviation. Here it would be 750 or 1125. Now your situation might produce a smaller standard deviation (maybe much much smaller), but it would be really hard to get a larger standard deviation, because physiology places limits on the variability of birthweights. What this means is that your estimate of sample size might be a bit too big if you use a standard deviation of 750 or 1125.
Now keep in mind that here are not any serious problems with a sample size that is too big. It's not like you are asking a bunch of patients to undergo a painful medical test or forcing half of your patients to forgo the active medicine for a placebo. The data is already collected. So you can't argue that it is unethical to have too large a sample size here.
The minimum clinically important difference here is actually not too hard. You know that a t-test with 1,314 subjects can detect a pretty small difference (about a tenth of a standard deviation, assuming equal sample sizes in each group). So figure out whether a tenth of a standard deviation is "small enough".
Did you like this article? Visit Sample Size Justification for more materials in the same vein.
2. Should I use a spreadsheet or a database to enter my data?
I often get asked whether you should use a spreadsheet (like Microsoft Excel) or a database (like Microsoft Access) to enter your data. The short answer is that for most projects it does not matter all that much. But here are some considerations that you should think about before making this choice. Databases easily allow you to implement quality checks. They also allow you to easily integrate data from multiple sources. Finally, they are more effective in handling very large data sets. On the other hand, spreadsheets are faster to set up and allow easier copying and duplication for data with repetitive patterns.
Quality checks: there are common sense rules that certain types of data must follow. For example, gender has only three possible values: male, female, and unknown (though if your researchers can't determine the gender of some of their patients, are they really qualified to conduct research?). A database can check for this and warn you if you create a fourth category for gender.
Another valuable quality check is to insure that the id codes that you have selected for your patient are truly unique. There's nothing more troubling than having two patients with id=33 and none with id=34. There are situations, of course, where id codes have to be repeated, such as in a longitudinal design, but if you have a simple setting where the id number is unique for every entry into your database, you can enforce a condition called unique primary keys that will beep when you try to enter a second patient #33 into your data set.
You can also look for combinations of variables that are inconsistent with what you know about the world. No men have a hysterectomy in their medical conditions; no six year old children are married, divorced, or widowed. If you see a birth date of 2007 and an examination date of 2002, then you either have an error in your database or an extremely far-sighted prenatal care program.
Quality checks are sometimes overkill, but they should definitely be considered in cases where you have a large data set with multiple different people responsible for data entry.
Data from multiple sources: While it is possible to link data from several divergent data sources in a spreadsheet, it is not all that easy. This is where a database can be truly helpful. You define diffierent tables for the different data sources as well as defnitions of how these tables should be linked (which fields are to be used to match things up and whether this is a one-to-one or a many-to-one match). The enforcement of unique id codes mentioned above is especially useful when you have multiple data sources.
A database is also useful for data entry in a multi-center clinical trial. A single spreadsheet can easily get overwritten when two people are adding data at the same time. Databases have ways of preventing this from happening.
Of course, if you have multiple data sources or a multi-center trial, then please, please, please consult a statistician very early in your planning process.
Very large data sets: A spreadsheet, typically, requires all of the data to be in memory at once, so as to allow efficient auto-recalculation. Auto-recalculation is not something you want during data entry to begin with, but the memory requirements typically limit spreadsheets to a relatively small number of rows and columns. This limit is typically at or very close to a power of two. Different versions of Microsoft Excel, for example, allow only include 32,767 (=2^15-1) or 65,536 (=2^16) or 1,048,576 (=2^20)rows. The number of columns is 256 (=2^8) in some versions, but newer versions have 16,384 (2^14) columns.
You might scoff and say "who would ever have the time to enter so much data as to come anywhere close to these limits." Scoff you may, but there are two considerations. First, some projects involve data entry combined with importing data from other sources. You might not enter 256 columns of data, but you could very easily import this many columns. Second, keeping even a few thousand rows of data in memory can slow you down greatly. A database stores all of its data on your hard drive and only calls up into memory the record that you are currently editing.
This article is adapted from a page on my old website:
* www.childrensmercy.org/stats/data/sheet.aspDid you like this article? Visit Data Management for more materials in the same vein.
3. A binary coding trick that you can learn from Car Talk
I often need to see how often certain variables and combinations of those variables appear in a data set. If the variable is binary, there is a trick for doing this that is illustrated by a Car Talk puzzler.
Car Talk is a program on National Public Radio where listeners call in to ask questions about car repair from two experts, Tom and Ray Magliozzi. As part of the show, they include a Puzzler. The Puzzler is a question, sometimes related to automobiles, but sometimes not. Some of the most interesting Puzzlers (to me anyway) are about Mathematics.
The mathematical puzzler that helps illustrate this binary coding trick is found at:
* www.cartalk.com/content/puzzler/transcripts/201117/index.html, and
* www.cartalk.com/content/puzzler/transcripts/201117/answer.html.The basic setup is that you have seven stacks of coins. Each stack has 100 coins in it, and all of the coins in the stack are either genuine or counterfeit. A genuine coin weights 10 grams and a counterfeit coin weights 11 grams. You could tell whether a stack of coins was counterfeit by weighing the stack. A value of 1,000 grams indicates a genuine stack of coins and a value of 1,100 grams indicates a counterfeit stack. Do this six more times and you would establish which stacks were genuine and which stacks were counterfeit. But there is a way to identify whether none, some, or all of the stacks are counterfeit and which ones they are, using a single weighing?
The way you do this is to select 127 coins: 1 from the first stack, 2 from the second stack, 4 (not 3) from the third stack, 8 from the fourth stack, etc. Following this sequence of powers of two, you would get 64 (=2^7) coins from the seventh stack. Notice that 1 + 2 + 4 + 8 + 16 + 32 + 64 = 127.
If all the coins are genuine, this stack will weight 1,270 grams. If only the first stack is counterfeit, you would be over by one gram because of the 11 gram counterfeit coin from this stack replaces the 10 gram genuine coin. Similarly if the second stack is counterfeit those two bogus coins would add two extra grams to your weight.
Notice what happens with 3 grams overweight. This occurs when only the first and second stacks are counterfeit. That's because we very carefully picked four instead of three coins from the third stack. If we had foolishly used three coins from the third stack, then three grams overweight could represent either the first and second stacks only being counterfeit or the third stack only being counterfeit. Likewise, we chose 8 coins for the fourth stack because the maximum amount of excess weight among the 1 + 2 + 4 coins in the first, second, and third stacks is 7.
The amount of excess weight tells you which stacks are counterfeit by a binary representation of that number. For example 66 is represented by 1000010 in binary and this tells you that the seventh stack (64 coins) and the second stack (2 coins) are the only counterfeit coins.
How does this help in Statistics? I had a project with five exclusion factors: cancer, trauma, iv drug abuse, certain neurological conditions, and acute lower back pain.
So I created a new variable:
COMPUTE cod=can*16+trm*8+ivd*4+neu*2+lbp*1.The variables can, trm, etc. were coded as 1 if the exclusionary criteria were met and 0 if they were not.
If none of the exclusionary criteria were met for a particular patient, you would see a value of 0. This is similar to having seven stacks of genuine coins. A value of 16 means an exclusion only because of cancer, 8 means an exclusion only because of trauma, etc. Here are the frequencies for the newly created variable.
 0 45020

   1  2095

   2   293

   3    90

   4    70

   5     6

   6     2

   8  8426

   9   754

  10    94

  11    30

  12    30

  14     1

  16  5037

  17   361

  18    63

  19    11

  20     7

  21     1

  24  1077

  25   126

  26    17

  27     3

  28     1
Notice that 45,020 patients have no exclusions. There are 15,921 cases with one and only one exclusionary criteria:
* 2,095 for acute lower back pain (1),
* 293 for neurological problems (2),
* 70 for iv drug abuse (4),
* 8,426 for trauma (8), and
* 5,037 for cancer (16).Certain codes correspond to exactly two exclusions:
* 3=1+2,
* 5=1+4,
* 6=2+4
* 9=1+8,
* 10=2+8,
* 12=4+8,
* 17=1+16,
* 18=2+16,
* 20=4+16, and
* 24=8+16).
There are 90 + 6 + 2 + 754 + 94 + 30 + 361 + 63 + 7 + 1,077 = 2,484 of these cases, with the most common combination of exclusion criteria being cancer and trauma (1,077 cases corresponding to the value of 24).Only a handful of cases have three exclusionary criteria
* 11=1+2+8,
* 14=2+4+8,
* 19=1+2+16,
* 21=1+4+16,
* 25=1+8+16,
* 26=2+8+16, and
* 28=4+8+16
corresponding to 30 + 1 + 11 + 1 + 126 + 1 = 187 cases. The most common of these combinations is cancer, trauma, and acute lower back pain (25).The only combination of exclusionary factors occuring four times is cancer, trauma, neurological problems, and acute lower back pain (27=1+2+8+16). No patients had all five exclusionary criteria, which would have coded as 31.
Here is a relabeling of the exclusion reasons
 none  (0) 45020

      b  (1)  2095

     n   (2)   293

     nb  (3)    90

    i    (4)    70

    i b  (5)     6

    in   (6)     2

   t     (8)  8426

   t  b  (9)   754

   t n  (10)    94

   t nb (11)    30

   ti   (12)    30

   tib  (14)     1

  c     (16)  5037

  c   b (17)   361

  c  n  (18)    63

  c  nb (19)    11

  c i   (20)     7

  c i b (21)     1

  ct    (24)  1077

  ct  b (25)   126

  ct n  (26)    17

  ct nb (27)     3

  cti   (28)     1
Note that b=acute lower back pain, n=neurologic problems, i=iv drug abuse, t=trauma, and c=cancer.
Did you like this article? Visit Data Management for more materials in the same vein.
4. Monthly Mean Article (peer reviewed): Ethical issues posed by cluster randomized trials in health research
Charles Weijer, Jeremy Grimshaw, Monica Taljaard, Ariella Binik, Robert Boruch, Jamie Brehaut, Allan Donner, Martin Eccles, Antonio Gallo, et al. Ethical issues posed by cluster randomized trials in health research Trials. 2011;12(1):100. Abstract: "The cluster randomized trial (CRT) is used increasingly in knowledge translation research, quality improvement research, community based intervention studies, public health research, and research in developing countries. However, cluster trials raise difficult ethical issues that challenge researchers, research ethics committees, regulators, and sponsors as they seek to fulfill responsibly their respective roles. Our project will provide a systematic analysis of the ethics of cluster trials. Here we have outlined a series of six areas of inquiry that must be addressed if the cluster trial is to be set on a firm ethical foundation: 1. Who is a research subject? 2. From whom, how, and when must informed consent be obtained? 3. Does clinical equipoise apply to CRTs? 4. How do we determine if the benefits outweigh the risks of CRTs? 5. How ought vulnerable groups be protected in CRTs? 6. Who are gatekeepers and what are their responsibilities? Subsequent papers in this series will address each of these areas, clarifying the ethical issues at stake and, where possible, arguing for a preferred solution. Our hope is that these papers will serve as the basis for the creation of international ethical guidelines for the design and conduct of cluster randomized trials." [Accessed on April 26, 2011]. http://www.trialsjournal.com/content/12/1/100.
Did you like this article? Visit Ethics In Research for more materials in the same vein.
5. Monthly Mean Article (popular press): Do Cellphones Cause Brain Cancer
Siddhartha Mukherjee. Do Cellphones Cause Brain Cancer? The New York Times. 2011. Description: An excellent overview of the limitations of Epidemiological research, illustrated by the perplexing findings about the link (or lack thereof) between cell phone use and brain cancer. My only complaint is that they did not address how difficult it is to decide when to close the door on further research. How many negative studies can you tolerate before you say, "Enough! Let's move on to something else." [Accessed on May 4, 2011]. http://www.nytimes.com/2011/04/17/magazine/mag-17cellphones-t.html.
Did you like this article? Visit Critical Appraisal for more materials in the same vein.
6. Monthly Mean Book: Impure Science: AIDS, Activism, and the Politics of Knowledge
Epstein, S., 1996. Impure Science: AIDS, Activism, and the Politics of Knowledge, University of California Press. Description: This book explores the research process from the perspective of AIDS research and notes how this disease has changed much of how we now conduct research, such as the new efforts to obtain community involvement in research, the use of placebos in research involving a serious disease with (back in the 1980s) no effective therapies available, and how decisions are made that a research "fact" has been established and that no further research is needed. I want to write an extensive article about this book in a future newsletter.
Did you like this book? Visit Critical Appraisal for more materials in the same vein.
7. Monthly Mean Definition: What is a calibration curve?
In analytical chemistry, you are interested in estimating the concentration of a chemical using some type of instrument, such as a chomatograph. As the name suggests, a chromatograph measures color intensity or fluorescence, which is related to the concentration of the chemical in your sample. The calibration curve helps you relate the amount of fluorescence observed in a sample to the estimated concentration.
Calibration is used in areas other than chromatography, but the general principles are the same.
With a chromatograph, you obtain a calibration curve by running a series of spiked samples with known concentration through your instrument. Often these spiked samples are run in duplicate or triplicate, but this is not a strict necessity.
The values corresponding to the known concentrations and the observed fluorescence levels are plotted on the x-axis and y-axis respectively. The order is very important here.
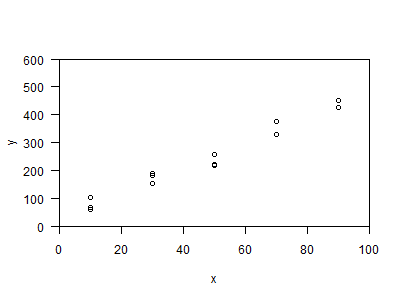
Here is an example of calibration data with 5 different spiked concentrations run in triplicate.
10  61

  10 104

  10  67

  30 155

  30 189

  30 182

  50 258

  50 222

  50 219

  70 377

  70 378

  70 331

  90 451

  90 453

  90 428
Here is a plot of the data.
Suppose you now run a sample with an unknown concentration through the system. The chromatograph reports a fluorescence of 200. What would you predict the chemical concentration to be.
Looking at the data, 30 is clearly too small, because its three fluorescence values are all below 200. By a similar logic, 50 is clearly too big. But what value between 30 and 50 would be your best estimate of the concentration? And how much uncertainty is there in this estimate?
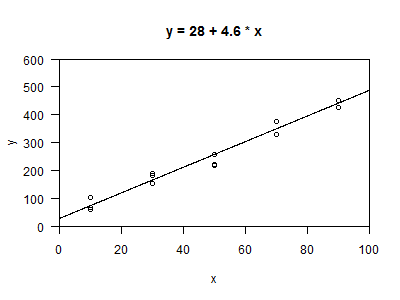
The figure above shows a plot of the data, with a regression line added. The intercept for this regression line is 28 and the slope is 5 (I rounded a bit to simplify the later calculations).
Notice that the regression line has an intercept that is not zero. You might object to this on scientific grounds--most of the principles behind chromatography presume that the fluorescence observed is proportional to the concentration of the chemical. This would lead to the natural conclusion that zero conccentation would lead to zero fluorescence. This is a reasonable assumption, and a model with a zero intercept would be more consistent with those assumptions.
Nevertheless, there are a lot of reasons why chemists allow the intercept to be non-zero. Most notably, there are often systematic errors in an instrument that cause fluorescence values to lie uniformly above or below the theoretical proportional relationship. The intercept can be thought of as an estimate of the systematic error in the instrument.
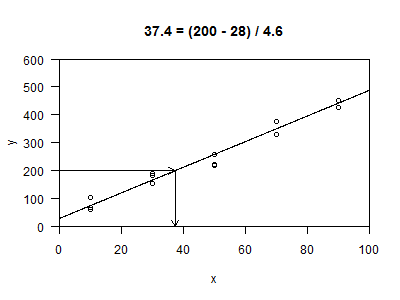
Now recall that you wish to estimate concentration for a sample that has a fluroescence of 200. This is the x value that corresponds to a y value of 200.
The graph shown above illustrates this computation. You subtract the estimated intercept and then divide by the estimated slope. Your best estimate of the concentration of a sample with a fluorescence of 200 is 37.3. This process is sometimes called inverse prediction or inverse regression.
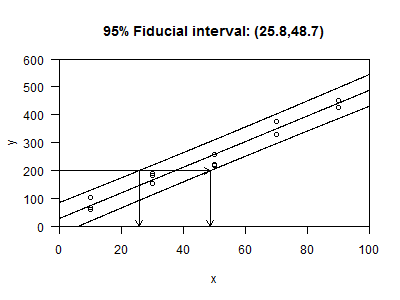
If you place prediction limits around your regression line, then you can project these back onto the x value as well, leading to what is commonly called a fiducial interval. The term "fiducal interval" is used here rather than confidence interval because this interval was created using an inverse process.
Strictly speaking, this interval is not a confidence interval, though it is often treated this way.
Why do you need to fit a regression line with fluorescence as the dependent variable and then invert the equation? Wouldn't it be simpler to fit a regression model where fluorescence is the independent variable and concentration is the dependent variable? After all, the dependent variable is the variable that we wish to predict, so why not go at that process directly.
The problem with using concentration as the dependent variable is that this is a fixed quantity under the control of the researcher. It is measured with little or no error. True, there may be some dilution errors, but typically these are quite small relative to the variations in fluorescence. In Statistics, we generally try to avoid setting where the independent variable is measured with error because it creates many difficulties. The small complexities introduced by inverse regression are well worth it, if we can avoid the greater complexities created by measurement error.
There are several other important issues about the calibration curve, such as a non-linear effect at the high end when saturation occurs (there is only so much fluorescence that you can squeeze out of a sample). Also, I have not covered the concepts of limit of detection and limit of quantitation. If there is sufficient interest, I will discuss these in a future newsletter.
Did you like this article? Visit Linear Regression for more materials in the same vein.
8. Monthly Mean Quote: When I talk to people about statistics...
When I talk to people about statistics, I find that they usually are quite willing to criticize dubious statistics--as long as the numbers come from people with whom they disagree. Joel Best, More Damned Lies and Statistics, page XI. Note I placed this quote in issue #23 of Chance News.
9. Monthly Mean Unsung Hero Award: J. Laurie Snell
J. Laurie Snell died last month, and the Statistics community will miss him greatly. I never met Dr. Snell, but I did interact with him, albeit indirectly, as a regular contributor to Chance News. Chance News was Dr. Snell's creation: a website that highlighted recent news stories illustrating the uses and abuses of statistics. This is a tremendous resource for Statistics teachers who want to show the relevancy of Statistics in everyday life. There is a nice tribute to Dr. Snell in Chance News #72:
* www.causeweb.org/wiki/chance/index.php/Chance_News_72
10. Monthly Mean Video: The Strange Powers of the Placebo Effect
TheProfessorFunk. The Strange Powers of the Placebo Effect. 2011. Abstract: "A look at the many strange effects of placebos. Created by: Daniel Keogh - http://www.twitter.com/ProfessorFunk, Luke Harris - http://www.lukeharrisgraphics.com. Sources: Ben Goldacre's book 'Bad Science' has an excellent chapter on placebos http://www.badscience.net/, http://www.amazon.co.uk/Bad-Science-Ben-Goldacre/dp/000728487X/?tag=bs0b-21. The Wikipedia page on Placebos is pretty excellent too: http://en.wikipedia.org/wiki/Placebo." [Accessed March 3, 2011]. Available at: http://www.youtube.com/watch?v=yfRVCaA5o18.
Did you like this video? Visit Placebo Controlled Trials for more materials in the same vein.
11. Monthly Mean Website: Migrating to R for SAS / SPSS / Stata Users
Vivan Lew. Migrating to R for SAS / SPSS / Stata Users [Accessed on May 3, 2011]. http://scc.stat.ucla.edu/page_attachments/0000/0115/09F_migrating.pdf.
Did you like this website? Visit R Software for more materials in the same vein.
12. Nick News: Overnight camp with Cub Scouts
I'm not much for roughing it in the wild, but when Nicholas's Cub Scout troop held a spring overnight family camping trip, I gritted my teeth and went along. It was actually quite fun.
Our tent is seriously dwarfed by everyone else's, but we had a gorgeous view from our location.
S'Mores are a requirement on these events, and Nicholas got his marshmallow nicely browned and it did not catch on fire.
He enjoyed fishing in spite of not catching anything. With half the kids fishing and the other half throwing rocks into the lake, what could you expect?
Cathy was working that weekend, but she joined us for some of the fun on Saturday evening.
13. Very bad joke: Jelly beans cause acne! Scientists! Investigate!
Note: this cartoon was originally published by Randall Munroe at xkcd.com/882/ and is licensed under the Creative Commons attribution-noncommercial license. Thank you, Mr. Munroe, for letting me share your cartoon with my readers.
Go to the original site and hover over the image to get a second hidden joke.
14. Tell me what you think.
How did you like this newsletter? I have three short open ended questions at
You can also provide feedback by responding to this email. My three questions are:
* What was the most important thing that you learned in this newsletter?
* What was the one thing that you found confusing or difficult to follow?
* What other topics would you like to see covered in a future newsletter?Two people provided feedback to the last newsletter. I got compliments on my discussion of the Poisson distribution and the video on the relationship between wealth and health. I also got a compliment for stressing the need to worry about false positives when evaluating a p-value. The section on the Bonferroni adjustment and other adjustments for multiple comparisons caused more than a bit of confusion. I also got some helpful comments on how to improve the article on subgroup findings. I was encouraged to write more about subgroup analysis. I also got a request to write about "using stats for population management." I'm not quite sure what this last comment means.
15. Join me on Facebook and LinkedIn
I'm just getting started with Facebook and LinkedIn. My personal page on Facebook is
* www.facebook.com/pmeanMy page on LinkedIn is
* www.linkedin.com/in/pmeanIf you'd like to be a friend on Facebook or a connection on LinkedIn, I'd love to add you.
What now?
Sign up for the Monthly Mean newsletter
Review the archive of Monthly Mean newsletters
![]() This work is licensed under a
Creative
Commons Attribution 3.0 United States License. This page was written by
Steve Simon and was last modified on
2017-06-15. Need more
information? I have a page with general help
resources. You can also browse for pages similar to this one at
Category: Website details.
This work is licensed under a
Creative
Commons Attribution 3.0 United States License. This page was written by
Steve Simon and was last modified on
2017-06-15. Need more
information? I have a page with general help
resources. You can also browse for pages similar to this one at
Category: Website details.