
[The Monthly Mean] December 2010--Tests of equivalence and non-inferiority
The Monthly Mean is a newsletter with articles about Statistics with occasional forays into research ethics and evidence based medicine. I try to keep the articles non-technical, as far as that is possible in Statistics. The newsletter also includes links to interesting articles and websites. There is a very bad joke in every newsletter as well as a bit of personal news about me and my family.
Welcome to the Monthly Mean newsletter for December 2010. If you are having trouble reading this newsletter in your email system, please go to www.pmean.com/news/201012.html. If you are not yet subscribed to this newsletter, you can sign on at www.pmean.com/news. If you no longer wish to receive this newsletter, there is a link to unsubscribe at the bottom of this email. Here's a list of topics.
Lead article: Tests of equivalence and non-inferiority
2. Conflict of interest disclosures
3. Internal pilot study
4. Monthly Mean Article (peer reviewed): Integrative medicine and the point of credulity
5. Monthly Mean Article (popular press): An AIDS Advance, Hiding in the Open
6. Monthly Mean Book: Group Sequential Methods with Applications to Clinical Trials
7. Monthly Mean Definition: L'Abbe plot
8. Monthly Mean Quote: If quotient rule you wish to know...
9. Monthly Mean Video: Biostatistics vs. Lab Research.
10. Monthly Mean Website: Science Based Medicine Blog
11. Nick News: Nicholas discovers that he likes doing chores, if there is money for it
12. Very bad joke: Sequential analysis: A means of stopping...
13. Tell me what you think.
14. Upcoming statistics webinars
15. Join me on Facebook and LinkedIn
1. Tests of equivalence and non-inferiority
When you are trying to establish equivalence or non-inferiority, you need to play by a different set of rules than traditional hypothesis testing. Here's a brief summary of what a test of equivalence/non-inferiority is, why you might want to use it and how you would conduct such a test.
A test of equivalence is a test of the hypothesis of no effect or no difference between two treatments. Now it is unreasonable to expect that two treatments would be perfectly identical. Instead, you need to define a range of clinical indifference and establish that the true difference in means or proportions lies inside the range of clinical indifference. For a test of non-inferiority, you need to establish that a new treatment is not substantially inferior to a standard treatment. Again you need to define a margin of clinical indifference but this time it is a one sided margin.
Why would you want a test of equivalence? Equivalence is the Goldilocks hypothesis test--you need to establish that a new treatment is not too much bigger and not too much smaller than a standard treatment. It appears commonly when looking at the blood concentration of a proposed generic drug. If it is not substantially higher or lower than the current drug on the market, you can infer that the generic drug has a comparable effect. Typically, establishing that the true average blood concentration that is at least 80% but no more than 125% of the standard drug concentration would lead to a claim of equivalence.
Why would you want a test of non-inferiority? It sounds almost illegal--a double negative! Often a new treatment competes on the basis of lower cost and/or fewer side effects. If the new treatment is not substantially worse than the current treatment, you would want to switch. For example, if you are comparing two pain relief drug, then if the true average pain rating using the 100 millimeter visual analog scale is not more than 10 millimeters worse for the new drug, it would be considered non-inferior. Most people don't mention a difference in pain levels when their visual analog scale score shifts by less that 10 millimeters.
How do you define the range of clinical indifference or the non-inferiority margin? There are some rules that are commonly used, but they don't make much sense to me. For example, if the current drug was shown to be better than placebo by a margin of x, then half of x is commonly considered a non-inferiority margin. A better approach would be to look at the economic costs associated with each treatment (both the monetary cost of the treatment and an economic assessment of the cost associated with side effects). Then examine the economic costs associated with a failure to cure. A balance of all of these costs will indicate what the range of clinical indifference or the non-inferiority margin should be.
How do you conduct a test of equivalence? You can't collect data on two patients in the new treatment and two patients in the standard treatment, calculate the inevitably large p-value, accept the null hypothesis, and then claim equivalence on this flimsy bit of data. There are three approaches that I've seen for establishing equivalence.
The first is to establish that the test has sufficient power for rejecting the null hypothesis under anything outside the range of clinical indifference. Then a large p-value could be considered evidence supporting equivalence. This approach is not used that commonly when the hypothesis of equivalence needs to be established a priori, but it is a useful informal way of establishing equivalence after the fact.
The second approach is to use two one-sided tests, the first test to show that you are above the lower limit of clinical indifference, and the second to show that you are below the upper limit of clinical indifference. Since a test that rejects the null hypothesis obviously has adequate power, rejecting the two one sided tests is sufficient to establish that the true difference in treatments is within the range of clinical indifference. Interestingly, this approach does NOT need an adjustment for multiple comparisons.
The third approach is to calculate the confidence interval and show that this interval lies entirely inside the range of clinical indifference. You can use a 90% confidence interval here and still have a test that has a Type I error rate of 5%.
I like the last approach best because it is easiest to explain. It also is easy to calculate appropriate sample sizes--if your range of clinical indifference is 10 units wide, you want to make sure that the width of your confidence interval is a something less than 10 units. A confidence interval with a full width of 15 units could never fit inside a range of clinical indifference that is 10 units wide. You don't want to plan for an interval that is exactly 10 units wide of course because then you would have to be incredibly lucky to have that interval fit inside the range of clinical indifference.
Conducting a non-inferiority test is much simpler. Just show that you exceed the non-inferiority margin using a one-sided test.
2. Conflict of interest disclosures
There's been a lot of concern recently about undisclosed conflicts of interest. I want to outline how I think these conflicts should be identified. I'm very interested in your thoughts and opinions.
Most journals ask authors to disclose conflicts of interest (sometimes they use a more neutral term: competing interests). The problem with many of these disclosures is that they are too vague and don't explain in sufficient detail what a conflict of interest is. Here's a series of questions that I would ask to identify and report on conflicts of interest
1. Does your paper promote or discourage the use of a commercial product? Comment: the primary conflict that should be reported involves conflicts with the promotion or discouragement of a commercial product. There are other types of conflicts that have been proposed, such as the tendency of people in a certain specialty to overstate the value of procedures done by those specialists so as to increase their customer base and their income (e.g, surgeons advocating surgical solutions). Others have proposed that recipients of government grants have a financial incentive to exaggerate any findings so as to encourage receipt of more grants in the future. Finally others have suggested that charitable contributions by a researcher to a particular agency may bias researchers. I find none of these alternative sources of conflict compelling. There is solid empirical evidence that promotion of a commercial product among those with financial ties leads to serious bias. The evidence of bias in the other areas is anecdotal at best. Furthermore, I believe that individuals with financial ties to commercial products have hyped these competing areas of conflict of interest. If almost everyone has a conflict of one sort or another, then conflicts associated with financial ties to a commercial product will be less likely to be seen as a disqualifying conflict.
2. Do you or a close relative have a financial association with the company produces the commercial product named above? Comment: this is the key problem with conflict of interest, companies that "pay" researchers to promote their products through peer-reviewed research publications. Examples of financial associations would be receipt of royalty income, consulting income, speaking fees, research support, or free lunches, though you should not limit yourself to just these examples. There should be a dollar limit, say receipt of income or items valued $25 or more. Receipt of free pens from a drug company, for example, do raise troubling issues, but reporting this level of detail would only serve to clutter and confuse. If the income received is substantial, say $5,000 or more, that fact should also be disclosed. There also needs to be a limit on the time frame, say five years. Financial associations associated that ended a long time ago should not be presumed as troublesome. Furthermore, asking for financial associations across an entire lifetime would make conflict of interest reporting too difficult, especially if you are old and forgetful like me. There are varying definitions of close relatives, but at a minimum, your current spouse, your children, and your parents should be considered close relatives.
3. Do you or a close relative have a financial association with a company that produces a competing product to the commercial product named above? Another common problem is the publishing of negative data about a drug or other treatment intended to drive sales of that product down and thus improving sales of the competitor's product.
If you answer yes to #1 and yes to #2 or #3, then you need to report a potential conflict of interest. Comment: It's important to recognize that financial associations are not problematic if the topic of the paper is irrelevant to your financial associations. Note that the mere mention of a commercial product does not trigger the need for financial disclosure. If you use a particular piece of medical equipment as part of the research study, but the paper does not actively promote the use of that medical equipment, there is no need to report a financial association.
4. Does your paper promote or oppose a change in rules and regulations? Comment: these would normally be government regulations, but in some rare cases changes in regulations by a non-government organization (such as the International Committee of Medical Journal Editors) might also be considered here.
5. Would you or a close relative benefit financially or be harmed financially from the suggested change in rules and regulations? Comment: government rules and regulations often affect income by allowing/limiting certain medical practices or by allowing/limiting government compensation through Medicare/Medicaid. There is a potential conflict of interest if your income is enhanced by changes in these rules and regulations (e.g., you're a midwife and you are advocating changes in regulations that reduce limits on how and when and where you can help deliver babies). Note that non-financial benefits and harms, such as greater prestige and publicity do not need to be noted here.
6. Do you or a close relative have a financial association with a company that would benefit from the suggested change in rules and regulations? Comment: this is again a major concern, companies that "pay" researchers to advocate changes that improve their profits. There is nothing wrong with companies making profits and there is nothing wrong with these companies and people associated with those companies to advocate on favorable changes in rules and regulations. But the readers of your paper want to know this information.
If you answer yes to #4 and yes to #5 or #6, then you need to report a potential conflict of interest. Comment: a paper that does not promote/discourage the use of commercial products and that does not promote/oppose changes in rules and regulations does not generally need a conflict of interest disclosure, unless the author decides otherwise (see #8).
The following question applies for peer-reviewers or authors of editorials/letters that comment on a peer-reviewed publication.
7. Do you have a close professional or personal relationship with one of the authors of the publication that you are discussing? Comment: A close professional relationship could include (but is not limited to) co-authoring a research publication together, serving on your dissertation committee, serving on their dissertation committee, or working at the same company. Personal relationships are much harder to define. They may extend beyond the immediate family to friends and colleagues, but some discretion and individual judgment is needed here.
8. Do you have any other relationship or association that would warrant disclosure? Comment: the questions listed above offer general guidance, but there may be some situations not covered here that warrant a conflict of interest disclosure.
3. Internal pilot study
An internal pilot study is frequently used when information critical to the determination of sample size (such as the overall response rate with a binary outcome, or the standard deviation for a continuous outcome) is not well characterized prior to the start of the research. Internal pilots were first recommended in Wittes and Britain (1990), and a detailed description of their use is found in Chapter 14 of Jennison and Turnbull (1999).
An internal pilot study can be thought of as a simple form of a group sequential trial. Like a group sequential trial, the details must be spelled out prior to any data collection. In an internal pilot study, a sample size is estimated on the basis of a parameter (e.g., standard deviation of the outcome measure). A certain fraction (often 50%) of that planned sample size is collected, and the parameter is re-estimated using the pilot data. The sample size calculation is then revised based on the parameter computed from the pilot data set. The experiment continues to the revised sample size, and includes data from the full experiment including the pilot phase in testing the research hypothesis.
Like group sequential trials, careful rules must be followed to avoid inflation of the Type I error rate.
Bibliography
* Christopher Jennison, Bruce W. Turnbull. Group Sequential Methods. 1st ed. Chapman and Hall/CRC; 1999.
* J Wittes, E Brittain. The role of internal pilot studies in increasing the efficiency of clinical trials. Stat Med. 1990;9(1-2):65-71; discussion 71-72
.4. Monthly Mean Article (peer reviewed): Integrative medicine and the point of credulity
John C McLachlan. Integrative medicine and the point of credulity. BMJ. 2010;341:c6979. Excerpt: "So called integrative medicine should not be used as a way of smuggling alternative practices into rational medicine by way of lowered standards of critical thinking. Failure to detect an obvious hoax is not an encouraging sign ." [Accessed December 28, 2010].
* http://www.bmj.com/content/341/bmj.c6979.full.
5. Monthly Mean Article (popular press): An AIDS Advance, Hiding in the Open
Donald G. Mcneil, Jr. An AIDS Advance, Hiding in the Open. The New York Times. 2010. Excerpt: "In the war against AIDS, a new weapon has emerged. It wasn�t a secret weapon. It was a well-established treatment pill that has only now been shown to be effective as a prevention pill too. Which raises a question: What took so long? " [Accessed December 27, 2010].
* http://www.nytimes.com/2010/11/28/weekinreview/28mcneil.html.
I highlighted this article in Issue #69 of Chance News:
* http://www.causeweb.org/wiki/chance/index.php/Chance_News_69#Research_is_slow
6. Monthly Mean Book: Group Sequential Methods with Applications to Clinical Trials
Christopher Jennison, Bruce W. Turnbull. Group Sequential Methods with Applications to Clinical Trials. 1st ed. Chapman and Hall/CRC; 1999. Excerpt: "This book describes statistical methodology for the group sequential design of studies in which interim analyses will be performed. The principal context in which we illustrate the methods will be that of clinical trials. However, application can be found in almost any area when an experiment or survey can be carried out in phases or where its duration is long enough to permit periodic interim analyses."
7. Monthly Mean Definition: L'Abbe plot
The L'Abbe plot is used in a systematic overview to highlight heterogeneity in the control response rate. Normally, the rate of success in the control group is plotted on the horizontal axis and the rate of success in the treatment group is plotted on the vertical axis. It is possible to plot other statistics, such as the average response in the control and treatment groups or the average attrition in the control and treatment groups. The size of the plotting symbols is proportional to the size of the studies.
The L'Abbe plot shows the degree of heterogeneity in the control group response rate. If the data is clustered on the left hand side of the graph, for example, then there is a relatively homogenous set of studies. The low control rate indicates that the set of studies recruited patients with fairly serious acuity, as very few patients experience a benefit under the control arm of the study.
If there is heterogeneity among the studies, meaning that the points are spread widely in the horizontal dimension, then you should look for evidence that the difference between treatment and control rates is consistent across the range of control response rate. An alternative which may occur is that the treatment is less effective for studies with high control rates, as there is little room for additional improvement in these studies. The L'Abbe plot may also help explain an outlying study--if the difference in rates is more extreme in one particular study and that study has an unusual control rate, that may be a sign that this study recruited patients substantially different from the other studies.
Here's an example of a L'Abbe plot.
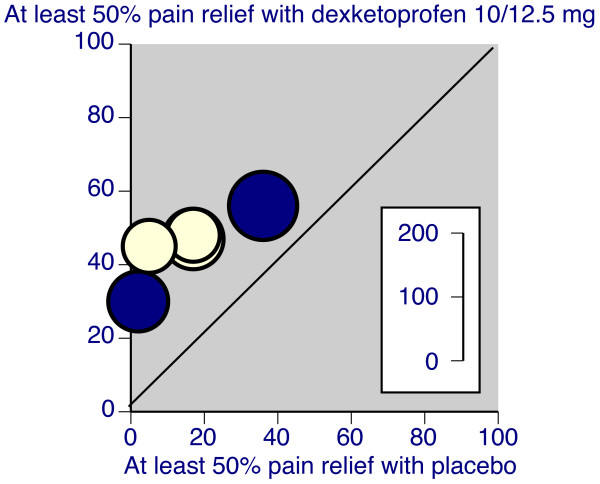
Notice that there is just a bit of heterogeneity, as the placebo response rate is almost non-existant in a couple of the studies and as large as 40% in a different study. Still the degree of improvement in the dexketoprofen group is relatively similar in all studies.
Source: R Andrew Moore, Jodie Barden. Systematic review of dexketoprofen in acute and chronic pain. BMC Clinical Pharmacology. 2008;8(1):11. [Accessed December 31, 2010]. Available at: http://www.biomedcentral.com/1472-6904/8/11.
8. Monthly Mean Quote: If quotient rule you wish to know...
If quotient rule you wish to know,
It's lo d hi less hi d lo.
Draw the line and down below
Denominator squared will go.I heard this Calculus poem a long time ago, but I can't find an example of it on the Internet, or anything indicating the original source. If you know the source, please email me. For those of you who are rusty in Calculus, here's a brief explanation on my website:
* http://www.pmean.com/10/QuotientRule.html
9. Monthly Mean Video
Note: I'm not a big fan of videos on the Internet, but there are still a few worth highlighting. I'll highlight them in this and upcoming newsletters.
Biostatistics vs. Lab Research. 2010. Description by the producer: "How not to collaborate with a biostatistician. This is what happens when two people are speaking different research languages! My current workplace is nothing like this, but I think most biostatisticians have had some kind of similar experiences like this in the past!" [Accessed August 25, 2010]. Available at: http://www.youtube.com/watch?v=PbODigCZqL8.
10. Monthly Mean Website: Science Based Medicine Blog
Steven Novella, David H. Gorski. Science-Based Medicine Blog. Excerpt: "Science-Based Medicine is a new daily science blog dedicated to promoting the highest standards and traditions of science in medicine and health care. The mission of this blog is to scientifically examine medical and health topics of interest to the public. This includes reviewing newly published studies, examining dubious products and claims, providing much needed scientific balance to the often credulous health reporting, and exploring issues related to the regulation of scientific quality in medicine." [Accessed December 27, 2010]. Available at: http://www.sciencebasedmedicine.org/. Note: This blog has commented critically on some of my webpages, which I do appreciate. I love getting fan letters, but the rare commentary that criticizes what I have written allows me to improve my writing. See
* http://www.pmean.com/10/ScienceBasedMedicinePt2.html
* http://www.pmean.com/10/UndeservingOfFurtherStudy.html
11. Nick News: Nicholas discovers that he likes doing chores, if there is money for it
For someone born in a Russian orphanage, Nicholas has turned out to be the ultimate capitalist. He loves money and will work extra hard and long on anything if there is a monetary reward waiting at the end. We put this to good use before it got too cold and got a nice car wash
and a well raked lawn.
The best part of raking, of course, is jumping in the big pile of leaves afterwards.
12. Very bad joke: Sequential analysis: A means of stopping...
Sequential analysis: A means of stopping a trial before it becomes useful. Stephen Senn, as quoted on page 300 of his book, Statistical Issues in Drug Development, Second Edition.
13. Tell me what you think.
How did you like this newsletter? I have three short open ended questions at
* https://app.icontact.com/icp/sub/survey/start?sid=6484&cid=338122You can also provide feedback by responding to this email. My three questions are:
* What was the most important thing that you learned in this newsletter?
* What was the one thing that you found confusing or difficult to follow?
* What other topics would you like to see covered in a future newsletter?Two people provided feedback to the last newsletter. I got positive feedback on the link on poster preparation tips. There was some confusion about the section on unequal sample sizes and on the log transformation. Suggestions about future topics included selective outcome reporting and multivariate outcomes in systematic overviews.
14. Upcoming statistics webinars
I've had to cancel the last two webinars due to lack of interest. It's partly my fault for not promoting these webinars more aggressively. I'm going to take a few months off and concentrate on this newsletter and my second book.
15. Join me on Facebook and LinkedIn
I'm just getting started with Facebook and LinkedIn. My personal page on Facebook is
* www.facebook.com/pmeanand there is a fan page for The Monthly Mean
* www.facebook.com/group.php?gid=302778306676I usually put technical stuff on the Monthly Mean fan page and personal stuff on my page, but there's a bit of overlap.
My page on LinkedIn is
* www.linkedin.com/in/pmeanIf you'd like to be a friend on Facebook or a connection on LinkedIn, I'd love to add you.
What now?
Sign up for the Monthly Mean newsletter
Review the archive of Monthly Mean newsletters
![]() This work is licensed under a
Creative
Commons Attribution 3.0 United States License. This page was written by
Steve Simon and was last modified on
2017-06-15. Need more
information? I have a page with general help
resources. You can also browse for pages similar to this one at
Category: Website details.
This work is licensed under a
Creative
Commons Attribution 3.0 United States License. This page was written by
Steve Simon and was last modified on
2017-06-15. Need more
information? I have a page with general help
resources. You can also browse for pages similar to this one at
Category: Website details.