News: Sign up for "The Monthly Mean," the newsletter that dares to call itself average, www.pmean.com/news.
| P.Mean: Mapping my runs in R (created 2012-10-10).
News: Sign up for "The Monthly Mean," the newsletter that dares to call itself average, www.pmean.com/news. |
|
I started running as part of a 2011 New Years resolution to build up my stamina to the point where I could run a five kilometer race. I didn't care too much how fast I ran, but I did want to run the whole way without stopping and without taking a walking break. I've run in about dozen different five kilometer and four mile races. In the middle of 2011, I bought an iPhone with a built-in GPS system. It is the coolest thing ever. I used that iPhone to track my runs and started sharing the maps of my runs with other details on my running log. You can produce nice running routes using Google Maps, but I wanted to be able to manipulate the data a bit, so I developed a simple program in R. Here are the details.
The GPS app that I use (MotionX GPS) produces files using GPX, a format for GPS files based on XML. The first few lines of a typical file look like this:
<gpx xmlns="http://www.topografix.com/GPX/1/1" xmlns:xsi="http://www.w3.org/2001/XMLSchema-instance" version="1.1" xsi:schemaLocation="http://www.topografix.com/GPX/1/1 http://www.topografix.com/GPX/1/1/gpx.xsd" creator="MotionXGPSFull 19.1 Build 4444R">

  <trk>

  <name>Track 004</name>

  <desc>Oct 9, 2012  8:38 am</desc>

  <trkseg>

  <trkpt lat="38.8581470" lon="-94.6331118">

  <ele>272.660</ele>

  <time>2012-10-09T13:38:24.508Z</time>

  </trkpt>

  <trkpt lat="38.8581470" lon="-94.6331118">

  <ele>272.674</ele>

  <time>2012-10-09T13:38:24.608Z</time>

  </trkpt>
The R program pulls out the latitude, longitude, elevation, and time data and stores it in a matrix. I won't show the details here, as it is fairly tedious.
You need to calculate distance from the latitude and longitude values. Here's the code for that calculation:
calc.dst <- function(g) {

  n <- dim(g)[1]

  k <- c(1,1:(n-1))

  r <- 6371*1000

  p <- 2*pi*r

  latm <- p/360

  lonm <- latm*cos(g[1,"plat"]*pi/180)

  latd <- latm*(g[,"plat"]-g[k,"plat"])

  lond <- lonm*(g[,"plon"]-g[k,"plon"])

  cumsum(sqrt(latd^2+lond^2))

}
The calculations are all in metric. A degree of latitude is 2pi r / 360, where r is the diameter of the earth (about 6,371 kilometers). A degree of longitude depends on how far you are from the equator. At the equator, it is the same distance as a degree of latitude. At either the North Pole or South Pole, it is 0. In between, you scale by a factor equal to the cosine of the latitude. Note the change from degrees to radians.
The distance travelled is a Pythagorean combination of the latitude change in meters and the longitude change in meters. I am interested in the cumulative distance travelled at each time point.
I compute the "center" of the map as being halfway between the maximum and minimum latitudes and longitudes.
map.cen <- function(g,gmar=10) {

  rlat <- range(g[,"plat"])

  rlon <- range(g[,"plon"])

  mlat <- mean(rlat)

  mlon <- mean(rlon)

  zm <-
MaxZoom(rlat,rlon,siz=rep(320-2*gmar,2))

    map.cen <- c(mlat,mlon,zm,rlat,rlon)

    names(map.cen) <- c("lat.cen","lon.cen","lat.zoom","lon.zoom","lat.min","lat.max","lon.min","lon.max")

    return(map.cen)

}
This program calls a function, MaxZoom, available in the RgoogleMaps program. This function goes to Google maps with a set of coordinates and finds out the maximum zoom level that will allow you to display all of the latitude/longitude pairs with a map. By default, it assumes a map with 640 by 640 pixels, but I want a smaller map (320 by 320 pixels). I also want a small margin around the map, so that the running route doesn't take you right to the edge.
Once you have this information, you can get a map from Google with the GetMap function, also part of the RgoogleMaps package.
map.goo <- function(cen.dat) {

  siz <- 320

  m <- GetMap(destfile="mapj.png",center=cen.dat[1:2],size=rep(siz,2),

  zoom=min(cen.dat[3:4]),maptype="hybrid")

  return(m)

}
The GetMpa function provides a list with, among other things, a bitmap that you can place on a graph. You can actually have GetMap draw the map directly, but I want to store the bitmap so I can re-use it without having to re-query Google Maps.
Now, you can draw place a bitmap on an R graph with the rasterImage function, which is part of the regular R package.
map.beg <- function(map.dat) {

  par(mar=rep(0,4),xaxs="i",yaxs="i")

  plot(c(-160,320),c(-160,160),type="n",axes=FALSE)

  rasterImage(map.dat$myTile,-160,-160,160,160)

}
It is important to use internal scaling (xaxs="i" and yaxs="i") to insure that R doesn't add an extra margin around your plot. Notice also that I have some room left over on the right hand side of the graph (the x-axis goes an extra 160 pixels than needed for the bitmap). This allows me to place additional information next to the map.
The only other tricky thing is to translate individual latitude/longitude pairs into pixel locations on the 320 by 320 map.
cal.pix <- function(gpx.dat,map.dat) {

  lt <- gpx.dat[,"plat"]

  ln <- gpx.dat[,"plon"]

  lt.cen <- as.numeric(map.dat["lat.center"])

  ln.cen <- as.numeric(map.dat["lon.center"])

  zm <-     as.numeric(map.dat["zoom"])

  pos.mp <- LatLon2XY(lt,ln,zm)

  cen.mp <- LatLon2XY(lt.cen,ln.cen,zm)

  pos.dat <- Tile2R(pos.mp,cen.mp)

  names(pos.dat) <- tolower(names(pos.dat))

  zele <- gpx.dat[,"pele"]-min(gpx.dat[,"pele"])

  cmb.dat <- as.matrix(data.frame(pos.dat,zele=zele,gpx.dat))

  print(tail(cmb.dat))

  return(cmb.dat)

}
This requires the LatLon2XY and Tile2R functions in RgoogleMaps. It's a pretty messy operation, and you should read the documentation to follow what is going on here. Google maps has an internal structure that involves locations within tiles within a given map. You need to find out which tile the current latitudue longitude pair is (you can input vectors of latitude/longitude pairs here) relative to the amount of zooming that you want to do. Then you need to find comparable information about the center of the map. That combined information will produce pixel locations for you.
Once you have the pixel locations of each latitude/longitude pair, you can use functions like lines, segments, and text to add features to your map. Here's an a example of what the output looks like.
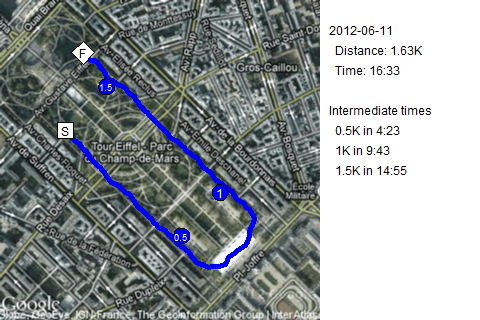
Can you guess where the location of this run is?
![]() This page was written by
Steve Simon and is licensed under the
Creative
Commons Attribution 3.0 United States License. Need more
information? I have a page with general help
resources. You can also browse for pages similar to this one at R Software.
This page was written by
Steve Simon and is licensed under the
Creative
Commons Attribution 3.0 United States License. Need more
information? I have a page with general help
resources. You can also browse for pages similar to this one at R Software.