When you want to describe probability for a continuous variable, you do so by describing a certain area. A large area implies a large probability and a small area implies a small probability. Some people don't like this, because it forces them to remember a bit of geometry (or in more complex situations, calculus). But the relationship between probability and area is also useful, because it provides a visual interpretation for probability.
Here's an example of a bell shaped curve. This represents a normal distribution with a mean of 50 and a standard deviation of 10.
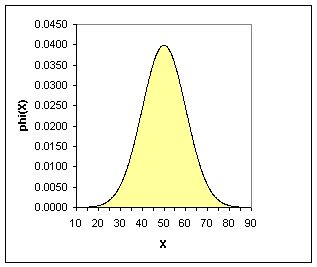
Notice that most of the area falls between 20 and 80. This means that values smaller than 20 or larger than 80 are extremely rare for this variable. Compare this to a normal distribution with a mean of 50 and a standard deviation of 2.
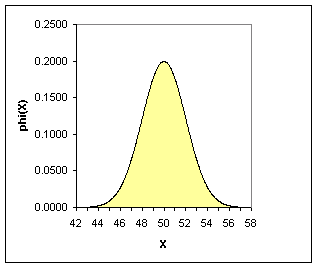
Although the picture looks similar, the scale has changed. Almost all of the area is between 44 and 56. With a smaller standard deviation, the probability is much more concentrated. Compare this to a normal distribution with the same standard deviation, 2, but a larger mean of 70.
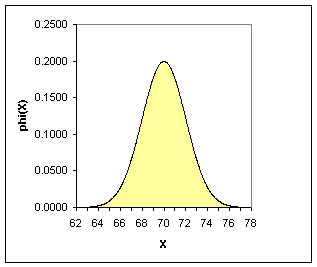
Now most of the area is between 64 and 76. The spread of the data is about the same, but the probability has shifted to larger values.
The normal distribution with a mean of 0 and and a standard deviation of 1 is very important. We refer to this distribution as the standard normal distribution. A picture appears below.
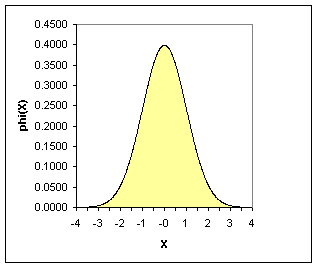
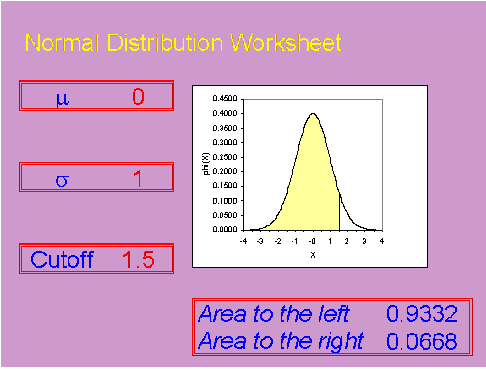
For the standard normal distribution, most of the area is between -3 and +3. Many statistical tables will show areas (or equivalently, probabilities) for the standard normal distribution. For example, the probability that a standard normal distribution is less than 1.5 is 0.9332.
If you know the probabilities for a standard normal distribution, it is not too hard to compute probabilities for other normal distributions.