Sample size for a diagnostic study (September 3, 1999)
This page is moving to a new website.
Dear Professor Mean, How big should a study of a diagnostic test be? I want to estimate a
sample size for the sensitivity and specifity of a test. I guess confidence intervals would
address this, but is there a calculation analogous to a power analysis that would apply to figure
out the size of the groups beforehand? -- Jovial John
Dear Jovial,
Sample size is not important. Just ask for enough in the research grant so that you can
buy your consulting statistician a new computer. Just kidding. You are actually pretty close
to having the right answer.
Power calculations are appropriate only when you have a research hypothesis.
The emphasis in a study of a diagnostic test is estimation. You want accurate estimates of
sensitivity, specificity and/or likelihood ratios.
When the focus is on estimation, you determine the sample size through the width
of the confidence interval. You specify how precise (how narrow) you want your
confidence intervals to be. This determines your sample size.
For sensitivity and specificity, use the standard formulas for a binomial
proportion. The formulas can be found in any introductory statistics book. For a
likelihood ratio, the formulas are a bit more complex, but the same principle applies.
Example
For example, suppose you want to estimate the
sensitivity (Sn) and specificity (Sp) of a
diagnostic test. Your best guess is that sensitivity will be at least 75% and specificity
will be at least 90%. The formula for a confidence interval for Sn or Sp would be
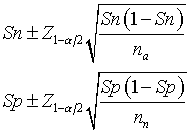
where na and nn are the number of abnormal (diseased) and normal
(healthy) patients in the study. You assess abnormal and normal under the gold standard, of
course.
A sample of size 50 abnormal and 50 normal patients would give a 95% confidence interval
of plus/minus 0.12 for Sn and plus/minus 0.083 for Sp. This seems like a reasonable amount of
precision. A sample of size 75 in each group would provide slightly narrower confidence
intervals (plus/minus 0.098 and plus/minus 0.068 respectively). Your choice of the sample
size depends in large part on the number of patients you can recruit from and also a balance
between maximizing precision and minimizing the amount of time you spend on this project.
Suppose instead that you wanted to estimate the area under the curve (AUC) for a
Received Operating Characteristic Curve (ROC curve). The formula
for a standard error here is a bit messier. The web page
www.anaesthetist.com/mnm/stats/roc/
offers a JAVAScript calculator for the standard error of the AUC. Let's suppose that the
AUC is going to be around 0.8. With the same 50 abnormal and normal patients, the standard
error would be 0.044, which is reasonably small. With 75 in each group, the standard error
would be 0.036.
Summary
Jovial John wants to know how many subjects to include in a research study of a new
diagnostic test. Professor Mean explains that you should select a sample size that will make
the confidence interval for sensitivity and/or specificity sufficiently narrow.