StATS: What is a Poisson distribution?
The Poisson distribution arises when you count a number of events across time or over an area. You should think about the Poisson distribution for any situation that involves counting events. Some examples are:
Sometimes, you will see the count represented as a rate, such as the number of deaths per year due to horse kicks, or the number of defects per square yard.
Four assumptions
Information about how the data was generated can help you decide whether the Poisson distribution fits. The Poisson distribution is based on four assumptions. We will use the term "interval" to refer to either a time interval or an area, depending on the context of the problem.
You should examine all of these assumptions carefully, but especially the last two. If either of these last two assumptios are violated, they can lead to extra variation, sometimes refered to as overdispersion.
Mathematical details
The Poisson distribution depends on a single parameter λ. The probability that the Poisson random variable equals k is

for any value of k from 0 all the way up to infinity. Although there is no theoretical upper bound for the Poisson distribution, in practice these probabilities get small enough to be negligible when k is very large. Exactly how large k needs to be before the probabilities become negligible depends entirely on the value of λ.
Here are some tables of probabilities for small values of λ.
 λ    0     1
  2     3

  0.1 0.905 0.090 0.005 0.000


   λ    0     1     2
  3     4     5

  0.5 0.607 0.303 0.076 0.013 0.002 0.000


   λ    0     1     2
  3     4     5
  6     7     8

  1.5 0.223 0.335 0.251 0.126 0.047 0.014 0.004 0.001 0.000
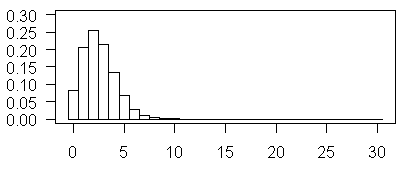
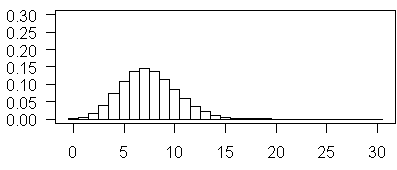
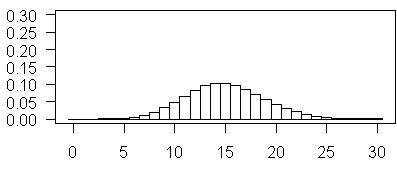
For larger values of λ it is easier to display the probabilities in a graph.

The plot shown above illustrates Poisson probabilities for λ = 2.5.

The above plot illustrates Poisson probabilities for λ = 7.5.

and this plot illustrates Poisson probabilities for λ = 15.
The mean of the Poisson distribution is λ. For the Poisson distribution, the variance, λ, is the same as the mean, so the standard deviation is √λ.
Empirical tests
There are also some empirical ways of checking for a Poisson distribution.
These methods need some minor adjustments if the time/area intervals for all your data values are not all the same.
If you are trying to decide whether a Poisson distribution applies to your data, be sure to combine empirical tests with a good understanding of how the data was generated.
Infection example
The infection rate at a Neonatal Intensive Care Unit (NICU) is typically expressed as a number of infections per patient days. This is obviously counting a number of events across both time and patients. Does this data follow a Poisson distribution?
We need to assume that the probability of getting an infection over a short time period is proportional to the length of the time period. In other words, a patient who stays one hour in the NICU has twice the risk of a single infection as a patient who stays 30 minutes.
We also need to assume that for a small enough interval, the probability of getting two infections is negligible.
We need to assume that the probability of infection does not change over time or over infants. In other words, each infant is equally likely to get an infection over the same time interval and for a single infant, the probability of infection early in the NICU stay is the same as the probability of infection later in the NICU stay.
And we need to assume independence. Here independence means two things. The probability of seeing an infection in one child does not increase or decrease the probability of seeing an infection in another child. In other words, infections don't spread from one infant to another. We also need to that if an infant who gets an infection during one time interval, it doesn't change the probability that he or she will get another infection during a later time interval.
All of these assumptions are suspect, but especially the last two. If one infant gets an infection it increases the chance that other infants will get the same infection, the infection rate changes from early in the NICU stay to later in the stay, since older infants have better immune systems; and some infants are more infection prone than others.
Car counting example.
Here's another example. A student tells me about a class project where he counts the number of cars that pass by a busy street during one minute intervals. He computes a mean of 10.3, and a variance of only 5.3. So this is an indication, perhaps, that the Poisson distribution does not fit this data well.
Let's look at the assumptions of the Poisson distribution in terms of cars.
First, is the probability of observing a car in a small time interval proportional to that interval? In other words when you change from a five second interval to a ten second interval, does the probability double? This seems reasonable enough.
Second is it impossible to observe two cars simultaneously in the same very narrow time interval? This might be a problem if you are counting cars in several lanes of traffic.
Third, does the probability stay the same over time? This might be a problem if you collect data during "rush hour" and "normal hours". It also might be a problem is some of your counting occurs during the weekday, and other counting during the weekend. Fortunately, this student collected data only between the hours of 10-11am, Monday through Friday.
Fourth, are the probabilities independent when you are counting in non-overlapping time frames. This might be a problem is cars purposely space themselves out or if traffic is regulated by a traffic light somewhere upstream from your traffic flow.
If your variance is a lot smaller than your mean, perhaps it is an indication of a violation of the fourth assumption. Cars do tend to space themselves out (although a few drivers tend to tailgate). This makes the counts more regular than you would expect from a Poisson. More regularity means less variation.
Further Reading
A brief discussion of the Poisson distribution can be found starting on page 89 of Rosner's book.
Summary
Nosy Norbert wants to know if some of his data follows a Poisson distribution. Professor Mean explains that the Poisson distribution often arises when you are counting events in a certain area or time interval. There are four conditions you can check to see if your data are likely to arise from a Poisson distribution.
Poisson data tends to have distibution that is skewed to the right, though it becomes closer to symmetric as the mean of the distribution increases. If your data comes from a Poisson distribution, then the mean and the variance of your data should be roughly equal.
This page was written by Steve Simon while working at Children's Mercy Hospital. Although I do not hold the copyright for this material, I am reproducing it here as a service, as it is no longer available on the Children's Mercy Hospital website. Need more information? I have a page with general help resources. You can also browse for pages similar to this one at Category: Definitions, Category: Poisson regression, Category: Probability concepts.