
StATS: What is a phi coefficient?
The phi coefficient is a measure of the degree of association between two binary variables. This measure is similar to the correlation coefficient in its interpretation.
Two binary variables are considered positively associated if most of the data falls along the diagonal cells (i.e., a and d are larger than b and c). In contrast, two binary variables are considered negatively associated if most of the data falls off the diagonal.
Formula for the phi coefficient.
The formula for Phi is

Notice that Phi compares the product of the diagonal cells (a*d) to the product of the off-diagonal cells (b*c). The denominator is an adjustment that ensures that Phi is always between -1 and +1.
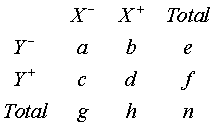
An example of computing Phi.
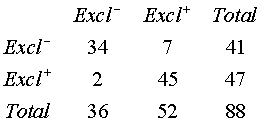
The data in the table below shows breast feeding status at discharge (columns) and 3 days after discharge (rows). Notice that most of the data are on the diagonal. This makes sense. Most mothers who were partial or no breast feeding at discharge would probably continue in that pattern three days later. The same holds true for exclusive breast feeding. This is shown by the Phi coefficient.


There is a strong association between breast feeding status at discharge and breast feeding status 3 days after discharge.
A second example.
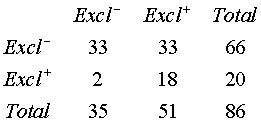
The following table is a similar measure of breast feeding, with the columns representing discharge and the rows representing 6 months after discharge.
Notice that there is still a tendency for values to fall in the diagonal cells, but it is less strong than the previous example. The computation of Phi emphasizes this:


There is a weak association between breast feeding status at discharge and at 6 months after discharge.
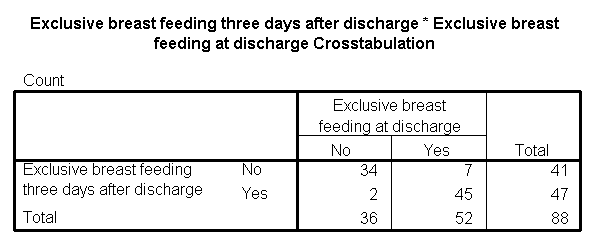
Using SPSS to compute Phi.
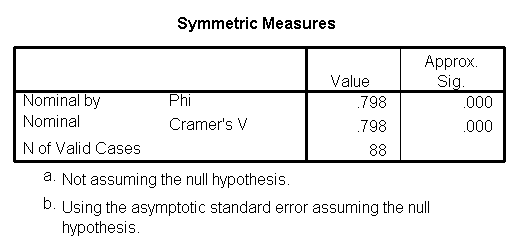
In SPSS, you create a two by two table by selecting ANALYZE | DESCRIPTIVE STATISTICS | CROSSTABS from the menu. In the dialog box, you can click on the STATISTICS button to get a second dialog box. In this dialog box, select the Phi and Cramer's V option.
Note: Cramer's V is useful for tables larger than 2 by 2. We will not discuss it in this presentation, but you can find details in Conover WJ Practical Nonparametric Statistics, 2nd Edition. (1980) New York NY: John Wiley and Sons, Inc. page 181.
Interpretation of the Phi coefficient.
I have general rule of thumb for correlation coefficients and you can use the same rule for the Phi coefficient.
This page was written by Steve Simon while working at Children's Mercy Hospital. Although I do not hold the copyright for this material, I am reproducing it here as a service, as it is no longer available on the Children's Mercy Hospital website. Need more information? I have a page with general help resources. You can also browse for pages similar to this one at Category: Definitions, Category: Measuring agreement.