StATS: What is an odds ratio?
The odds ratio is a way of comparing whether the probability of a certain
event is the same for two groups.
An odds ratio of 1 implies that the event is equally likely in both groups.
An odds ratio greater than one implies that the event is more likely in the
first group. An odds ratio less than one implies that the event is less
likely in the first group.
Shown below is the typical 2 by 2 table.

You can understand the odds ratio by first
noticing what the odds are in each row of the table. The odds for row Y- are
a/b. The odds for row Y+ are c/d. The odds ratio (OR) is simply the
ratio of the two odds.

which can be simplified to

Notice that if the odds are the same in each row, then the odds ratio is 1.
Examples
The data listed below is from the breast feeding study.

In the control row, the odds for exclusive breast feeding at discharge are
27 to 20 or odds slightly in favor of exclusive breast feeding. In the
treatment row, the odds are 10 to 32 or odds strongly against exclusive
breast feeding. The odds ratio for exclusive breast feeding at discharge is
(27/20) / (10/32) = 4.32. Since this number is larger than 1, we conclude
that breast feeding at discharge is more likely in NG Tube group.
The data in the table below is information about infant birth weights and
mortality among white infants in New York City in 1974.
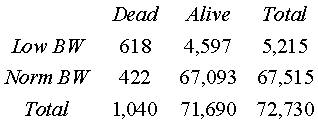
The odds ratio for death in one year is

This odds ratio illustrates that mortality is far more likely in the low
birth weight group.
The relative risk.
A more direct measure comparing the probabilities in two groups is the
relative risk, which is also known as the risk ratio. The relative risk is
simply the ratio of the two conditional probabilities.
Like the odds ratio, a relative risk equal to 1 implies that the the event
is equally probable in both groups. A relative risk greater than 1 implies
that the event is more likely in the first group. A relative risk less than 1
implies that the event is less likely in the first group.
The relative risk is simply the ratio of the two conditional probabilities.
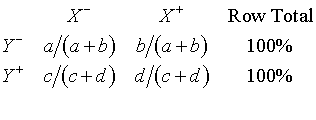
The relative risk (RR) for the event X- would be given by the following
formula

We can also define the risk ratio for the
event X+. It would be the ratio of the conditional probabilities in the
second column, i.e.,


Examples
In the breast feeding study, the table below represents conditional
probabilities.
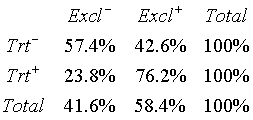
The relative risk for exclusive breast feeding is
RR = 42.6 / 76.2 = 0.56
The relative risk for Partial/No breast feeding is
RR = 57.4 / 23.8 = 2.41
Both statistics tell us the same essential story. This first relative risk
tells us that the probability of exclusive breast feeding at discharge is
less likely for the bottle group compared to the NG Tube group. The second
relative risk tells us that Partial/None breast feeding is more likely in the
bottle group.
The following table on infant mortalities lists conditional probabilities.
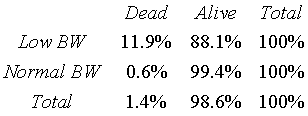
The risk ratio for early mortality is
RR = 11.9 / 0.6 = 19.8
Note: if you work with the unrounded percentages, you get a risk ratio of
18.96.
This large of a relative risk shows that the low birth weight group has a
much higher risk of early mortality.
Using SPSS.
If you use SPSS to create a 2 by 2 table (ANALYZE | DESCRIPTIVE STATISTICS
| CROSSTABS), then in the dialog box, there is a button labelled STATISTICS.
Press this button to get a new dialog box and check the option button next to
RISK. This provides an odds ratio, and two risk ratios.
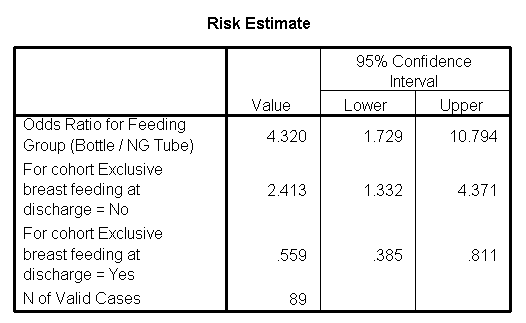
The odds ratio is in the first row (4.32). The relative risk for exclusive
breast feeding=No is in the second row (2.41). The relative risk for
exclusive breast feeding=Yes is in the third row (0.56).
This page was written by
Steve Simon while working at Children's Mercy Hospital. Although I do not hold the copyright for this material, I am reproducing it here as a service, as it is no longer available on the Children's Mercy Hospital website. Need more
information? I have a page with general help
resources. You can also browse for pages similar to this one at Category:
Definitions, Category:
Measuring agreement.


