StATS: Colors for R graphs (June 28, 2006)
I tend to use color sparingly in graphs because most of my graphs end up in black and white in the final production. Even on my web pages, which appear in color, I try to avoid too much use of color because I often print these pages on a black and white printer.
So when I did end up using color in a graph, it was often done rather haphazardly. In R, for example, you can control the color of lines, points, and text by inserting the argument col=x into the appropriate function. So for example, the code
plot(x,y,type="n")

  text(x[g==0],y[g==0],"C",col=2)

  text(x[g==1],y[g==1],"T",col=3)
in.print(width=8,height=10.5,printer="Adobe PDF")

  pa
would produce a graph where all the data points with the variable g equal to 0 would be red C's and all the data points with the variable g equal to 1 would be green T's. I never bothered figuring out how to get a particular color all that carefully because I never needed to worry too much about it.
But someone asked for a graph with black and gray lines, and I figured I better figure out how to make gray lines (black is easy because that is the default color). It turns out that you can specify colors in R by using a string argument rather than a number. So the code for drawing black and gray lines would look something like
plot(x,y,type="n")

  lines(x[g==0],y[g==0],col="black")

  lines(x[g==1],y[g==1],col="gray")
Now, what are all the possible text strings that you can specify? It turns out that there is an R function, colors() that lists all the possible colors that you can specify with a text string. In the version I am using right now (2.2.1) there are 657 choices from "aliceblue" through "yellowgreen." There are ranges of colors like azure1 through azure4. The range of grays is especially wide (gray1 through gray100) and the folks who wrote R were even nice enough to repeat that list using the British English spelling (grey1 through grey100). You can even review the same list by using the function, colours(). How thoughtful!
I wrote a short program that produces all the colors in a PDF file.
win.print(width=8,height=10.5,printer="Adobe PDF")

  par(mar=rep(0,4))

  ncolumns <- 7

  nrows <- 100

  npages <- trunc(length(colors())/(ncolumns*nrows))+1

  for (i in 1:npages) {

   plot(c(0,(ncolumns+1)),c(0,nrows+1),xlab=" ",ylab=" ",axes=F,type="n")

   for (j in 1:nrows) {

    for (k in 1:ncolumns) {

     x <- ncolumns*nrows*(i-1)+(k-1)*nrows+j

     text(k,nrows+1-j,paste(x,"=",colors()[x]),col=colors()[x],cex=0.5)

    }

   }

  }

  dev.off()
I named the PDF file, Rcolors.pdf. Some of the very light colors are almost invisible on a white background. Different graphical systems may display these colors differently, so only use this as a rough guide. You can specify your own colors using the rgb() function. For example, the command
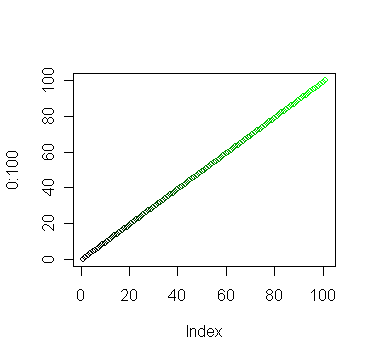
plot(0:100,col=rgb(0,(0:100)/100,0))
draws a series of points on the diagonal from the darkest green to the lightest green (see below).

If you need a special range of colors for a contour plot or a heatmap, then you can use the palette() function. refer to the help function in R for details.
There is an excellent book which I have just started reading that provides much useful information about graphs in R.
This page was written by Steve Simon while working at Children's Mercy Hospital. Although I do not hold the copyright for this material, I am reproducing it here as a service, as it is no longer available on the Children's Mercy Hospital website. Need more information? I have a page with general help resources. You can also browse for pages similar to this one at Category: Graphical display or Category: R software.