
When one group only has a single observation (May 24, 2005)
This page is moving to a new website.
Someone asked me about a lab study comparing expression levels for two groups of patients. The first group has two copies of a gene and the second group has three copies of the gene, thanks to a chromosomal duplication. That sounds easy enough to do. You could use a t-test in SPSS. Actually, I prefer to use the general linear model, which provides exactly the same test, but the output looks nicer and it allows you to easily incorporate more complex research designs.
The kicker in this analysis, though, is that there is only one patient in the second group. This person asked if he could perform a t-test in SPSS.
This is a situation where I would be strongly tempted to lie. I would not want to perform a t-test in this situation because it makes a questionable assumption about the data and it offers almost no precision.
It turns out, though, that SPSS will allow you to run an analysis for this case. I had to check it to be sure, so I made up some data where the first group had a single value (100) and the second group had three values (25, 40, and 55). Here's what the t-test output looks like in SPSS. Notice that I had to split the second table in SPSS into three pieces so it would fit on this web page.

The first table tells you what you already guessed, that you cannot compute a standard deviation for a group with only one observation.
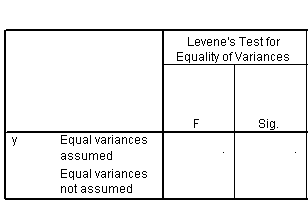
The left portion of the second table tells us that you cannot compute the Levene test either. I am not too upset about this because I don't like the Levene test.
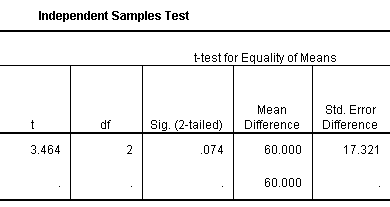
The middle portion of the second table shows a p-value for this test, but only for the first row (Equal variances assumed). This makes sense. What other choice would you have for a group without any standard deviaiton?
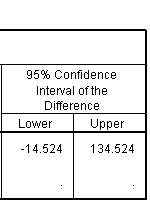
The right portion of the second table shows the confidence interval for the difference in means. Notice that this interval is painfully wide. It hurts me just to look at it. The observation in the first group is four full standard deviations away from the mean of the second group and we still cannot state that this difference is statistically significant.
Here's what the output looks like using the General Linear Model.

The first table reminds you that our first group only has a single observation.
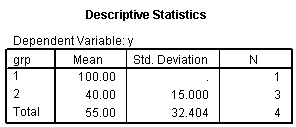
The second table reminds you that you cannot estimate a standard deviation for the first group.
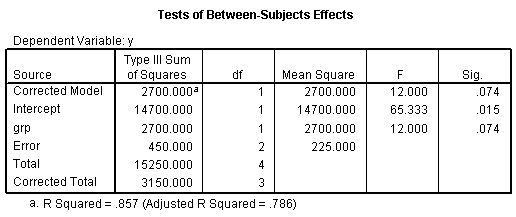
The third table shows that the huge difference that you see here is not statistically significant. Notice that this model accounts for 86% of the variation, a huge amount, and yet you still do not have a statistically significant finding.

The last table shows the same confidence interval, which is frustratingly wide.
There are two important lessons with this example. First, when one of your groups has a single observation, you have to assume that the variation in this group would be the same as in the other group. This is a very strong assumption, and one that you should not make without serious thought.
Second, the level of precision that you get with a single observation is so pathetic that even a four standard deviation shift does not achieve statistical significance. In many research studies, the size of the differences observed is far far smaller, typically a quarter to a half of a standard deviation. With one observation in the first group, you would need a Godzilla sized difference and then some between the two groups to have any hope of showing a statistically significant difference.
You should never intentionally design a research study with only a single observation in one of the groups. It forces you to make a questionable assumption about variability and it has almost no precision. If you encountered such a situation, though, after the fact, then it is indeed possible to perform a t-test. I'll leave it to your conscience whether you SHOULD perform such a test.