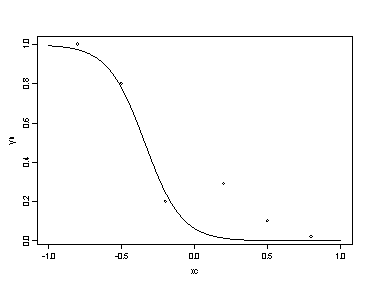
I've worked on a brief explanation of how to fit an S-shaped curve using SPSS and someone wanted to know how to do this in S-plus. Here's a simple example.
xc <- c(0.8,0.5,0.2,-0.2,-0.5,-0.8)

   yn <- c(0.02,0.10,0.29,0.20,0.80,1.00)

   nls.mod1 <- nls(yn~1/(1+exp(b*xc-a)),start=list(a=0,b=10))

   summary(nls.mod1)


   Formula: yn ~ 1/(1 + exp(b * xc - a))


   Parameters:

     Value Std. Error t value

   a -2.70380     1.4019 -1.92867

   b  7.90714     3.7126  2.12981


   Residual standard error: 0.149848 on 4 degrees of freedom


   Correlation of Parameter Estimates:

       a

   b -0.908


   plot(xc,yn,xlim=c(-1,1))

   x.grid <- seq(-1,1,by=0.01)

   lines(x.grid,predict(nls.mod1,newdata=list(xc=x.grid)))
This same code should also work in R.