This page has moved to my new website.
Many people use the words "rates" and "proportions" interchangeably, but there is an important distinction that I draw.
A proportion represents a situation where the numerator and denominator both represent counts, and the numerator is a subset of the denominator. For example, the numerator is the number of low birth weights and the denominator is the number of all births. Proportions are tested using binomial methods. In particular, in a before and after design, you would get a two by two table and can use a Chi-square test or Fisher's Exact test.
Rates represent a situation where the numerator is a count, but the denominator is in different units (such as the number of patient years of risk) or where the numerator is not a subset of the denominator (such as number of automobiles in a town divided by the number of adults living in that town). Rates are tested using Poisson methods. The tests here are less well known, but you can find the details in most standard Epidemiology textbooks.
You might also review the distinction between prevalence and incidence, as the former is a good example of a proportion and the latter is a good example of a rate.
In proportions where the numerator is very much smaller than the denominator, the tests using Poisson methods are good and useful approximations to tests based on binomial methods. That may be one reason why people will often use "rate" and "proportion" interchangeably.
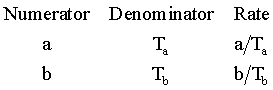
Here's a conceptual framework for the comparison of two rates
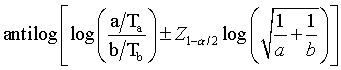
You could compute a rate ratio for this data, and the confidence interval would look something like
It's a bit surprising, perhaps, but the denominators of the two rates play no part in determining the variability of the confidence interval. Accumulating 100 patient years of data and counting 20 events is no different than accumulating 100,000 patient years of data and counting 20 events.
Here's a conceptual framework for the comparison of two proportions:
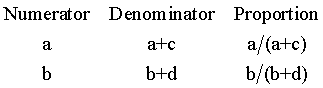
You might want to compute an odds ratio for data like this, and the formula for the confidence interval looks something like
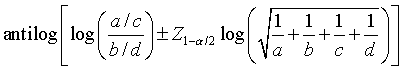
When both c and d are large (compared to a and b), the last two terms under the square root become negligible, and you get a formula not too much different than that for the rate ratio.
The formulas I show above are the simplest formulas but not necessarily the best formulas, nor should you draw the conclusion that the odds ratio is the best way to compare two proportions. It is interesting, though, to see the similarities and differences between the two approaches.