This page has moved to my new website.
Someone asked me for some help with calculating an appropriate sample size for a study comparing two treatments, where the outcome measure is ordinal (degree of skin toxicity: none, slight, moderate, severe). It turns out that an excellent discussion of the various approaches appears in a recent journal article with full free text on the web.
Sample size and power estimation for studies with health related quality of life outcomes: a comparison of four methods using the SF-36. Walters SJ. Health Qual Life Outcomes 2004: 2(1); 26. [Medline] [Abstract] [Full text] [PDF]
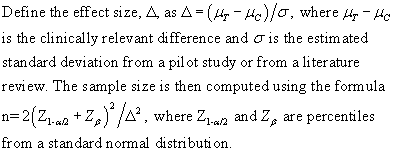
If your data is normally distributed, then the classic formulas for sample size work just fine.
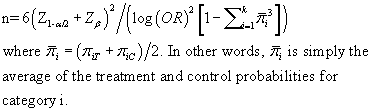
If your data is continuous, but non-normal, then the Mann-Whitney test is a good choice. Define the effect size, P, as P[Y>X], where Y and X are randomly selected values from the treatment and control groups. The formula for the sample size is
You want to select P so that the two distributions, normal or non-normal, are separated by an amount that is clinically relevant.
If your data is a small number of ordered categories, then an ordinal logistic regression model is an attractive choice. Ordinal logistic regression relies on the proportional odds assumption. Consider an ordinal variable with four levels: A, B, C, and D. You could compute an odds ratio by partitioning the data
The proportional odds assumptions says that no matter which of these partitions you choose, you still end up with the same odds ratio.
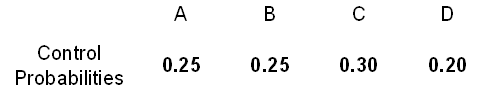
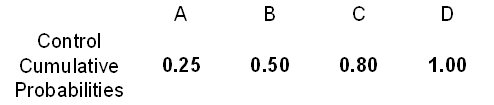
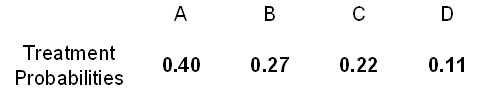
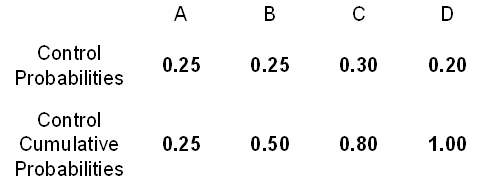
If you have a set of control probabilities, it is easy to see what the treatment probabilities will be under the proportional odds assumption. Let's start with the probabilities listed below.
Compute the cumulative probabilities, that is, the probability of A, then A/B, then A/B/C, and then A/B/C/D. The last of these has to equal 1.00.
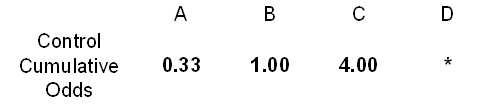
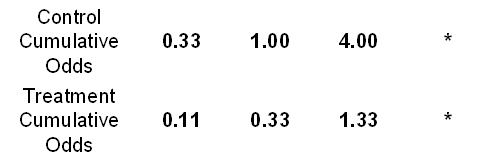
Now compute the cumulative odds, which is just the cumulative probability divided by its complement. For example, in column C, the cumulative probability is 0.8. The cumulative odds would be 0.8/0.2 = 4.0. You won't be able to compute an odds for the last column.
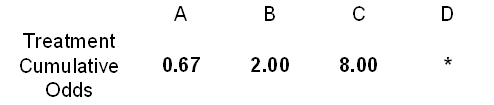
Multiply those odds by a common ratio. Here we use a common ratio of 2.0.
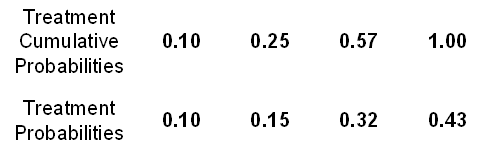
Convert the odds back into cumulative probabilities.
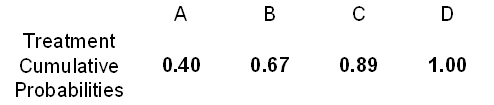
Finally convert the cumulative probabilities back into simple probabilities.
Here's what the calculations would look like if the odds ratio was 0.33 rather than 2.0.
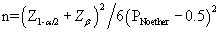
The formula for sample size with ordinal logistic regression is
Let's look at all three calculations at the same time. First, let's assume that categories A through D can be represented by the numbers 0 through 3. With probabilities of 25%, 25%, 30%, and 20% for the control group and 40%, 27%, 22%, and 11% for the treatment group, you would have means (sd) of 1.45 (1.07) and 1.04 (1.03) respectively. Using the larger of the two standard deviations, we get an effect size of 0.38. With the smaller standard deviation, your effect size is 0.40.
With a two sided alpha level of 0.05 and power of 80%, the estimated sample size would somewhere between 100 and 107.
With a bit of effort, you can calculate P, the probability that a randomly selected treatment is larger than a randomly selected control. That probability is 39.3%. With the same alpha level and power, the estimated sample size would be 115.
For the ordinal logistic regression, the values for pi-bar would be 32.5%, 26%, 26%, and 15.5%. Again using the same alpha and power, we get a sample size of 106.
I have a Microsoft Excel spreadsheet that performs sample size calculations for the ordinal logistic regression model. It is not thoroughly tested, so use it at your own risk.