This page has moved to my new website.
Selection of controls in a case-control study is difficult enough, but you also have to worry about the selection of the cases. Do you select incident cases (for example all breast cancer patients newly diagnosed during a given time frame) or prevalent cases (for example, all breast cancer patients who are alive during a given time frame).
These can lead to very different answers, because the probability of finding a case in a given time frame is related to mortality risk. Those patients who have a mild form of disease and survive for a relatively long time have a good chance of being around on the date that you go looking for them. Those patients who die quickly are unlikely to be around on the date that you go looking for them.
Let's consider an example with simulated data.

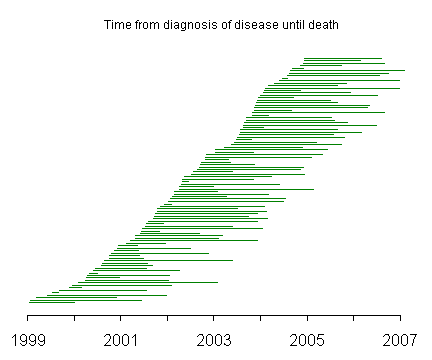
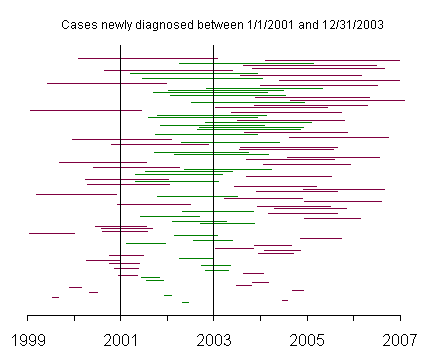
The lines on this graph represent the duration of disease with the left endpoint representing the date that the disease was first diagnosed and the right endpoint representing the date that the patient died. The line segments are ordered from the time of initial diagnosis with patients diagnosed in 1999 and 2000 at the bottom of the graph and patients diagnosed in 2003 and 2004 at the top of the graph.
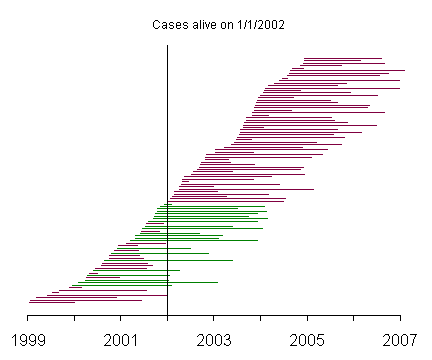
This graph represents a selection of prevalent cases, and the green lines represent those patients who were alive on January 1, 2002.
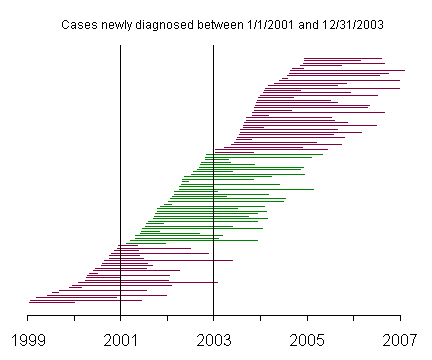
This graph represents incident cases, and the green lines represent those patients newly diagnosed with the disease between January 1, 2001 and December 31, 2003.
The prevalent cases include very few patients with short survival time, compared to the incident cases. This becomes more apparent when you reorder the patients by survival time.
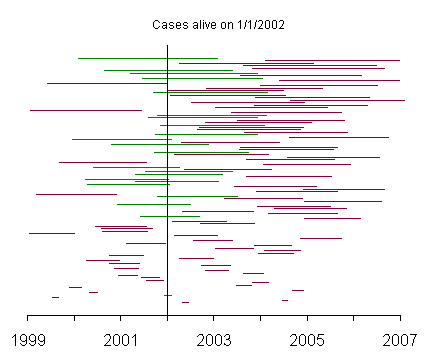
In this graph, the patients with the shortest survival times appear at the bottom of the graph and the patients with the longest survival times appear at the top. Notice how rarely the patients with short survival times appear among the prevalent cases.
This graph shows the incident cases with the patients again sorted by survival time. Notice that the incident cases include a fair number of patients with short survival times.
This can make a critical difference for a case control design where you have risk factors that are associated not with the disease itself, but with mortality. Any risk factor that makes a person die quickly is going to be underrepresented among prevalent cases and could lead to a spurious finding. This is sometimes called Neyman's bias. A good description of this appears in a Victor Schoenbach article "Sources of Error" on the web:
Prevalence-incidence (Neyman) bias
This is Sackett's term for, among other things, selective survival. Also included are the phenomena of reversion to normal of signs of previous clinical events (e.g., "silent" MI's may leave no clear electrocardiographic evidence some time later) and/or risk factor change after a pathophysiologic process has been initiated (e.g., a Type A may change his behavior after an MI), so that studies based on prevalence will produce a distorted picture of what has happened in terms of incidence. -- www.epidemiolog.net/evolving/SourcesofError.pdf
The Phillips article referenced below indicates the particular problems that Neyman's bias can cause when assessing the prognosis of breast cancer patients. The Sackett article is the basis for some of Schoenbach's comments above.
Further reading
--> Bias in analytic research. Sackett DL. J Chronic Dis 1979: 32(1-2); 51-63.
--> Breast carcinomas arising in carriers of mutations in BRCA1 or BRCA2: are they prognostically different? Phillips KA, Andrulis IL, Goodwin PJ. J Clin Oncol 1999: 17(11); 3653-63. [Medline] [Abstract] [Full text] [PDF]